

Image Source: Pexels
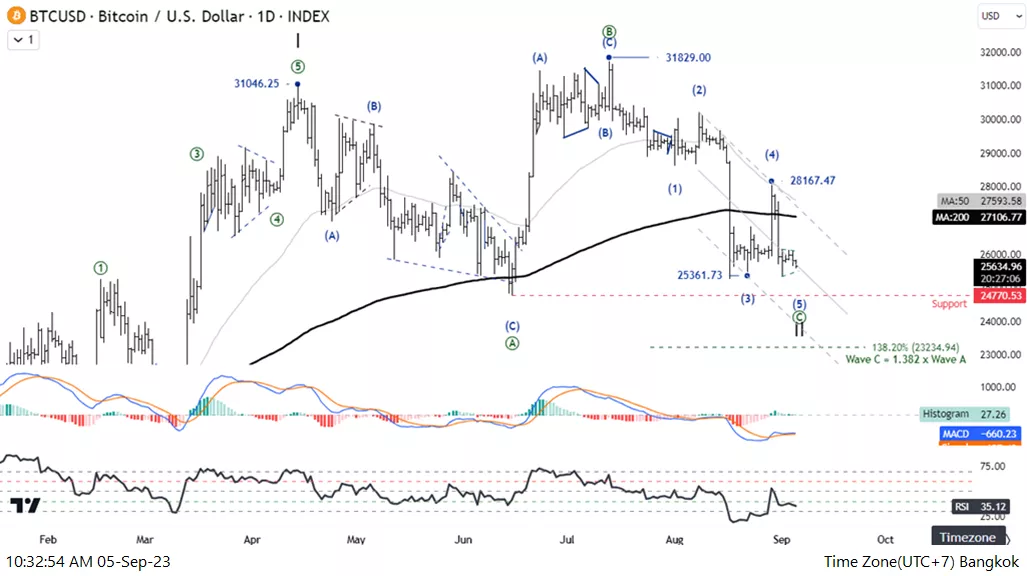
Elliott Wave Analysis TradingLounge Daily Chart, 5 September 2023
Bitcoin/U.S. Dollar(BTCUSD)
BTCUSD Elliott Wave Technical Analysis
Function: Counter Trend
Mode: Corrective
Structure: Flat
Position: Wave((C))
Direction Next higher Degrees: wave II of Motive
Wave Cancel invalid level:
Details: Five-wave extension of wave C is likely to be below 25361.73.
Bitcoin/U.S. Dollar(BTCUSD) Trading Strategy: The price structure in the downtrend continues. Also, the price is below the MA200. But even so Wave 5 is the last wave in a Motive wave pattern warning before changing the trend, So wait a wave 5 complete to find trade setup.
Bitcoin/U.S. Dollar(BTCUSD) Technical Indicators: The price is above the MA200 indicating an uptrend. MACD and RSI bearish momentum.
Analyst: Kittiampon Somboonsod, CEWA
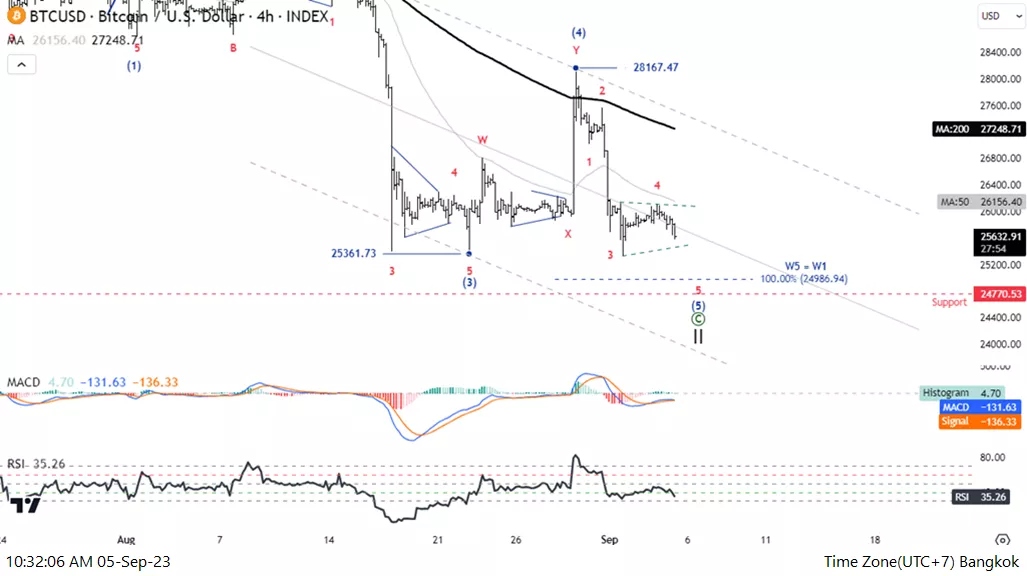
Elliott Wave Analysis TradingLounge 4H Chart, 5 September 2023
Bitcoin/U.S. Dollar(BTCUSD)
BTCUSD Elliott Wave Technical Analysis
Function: Counter Trend
Mode: Corrective
Structure: Flat
Position: Wave((C))
Direction Next higher Degrees: wave II of Motive
Wave Cancel invalid level: 28635.53
Details: Five-wave extension of wave C is likely to be below 25361.73.
Bitcoin/U.S. Dollar(BTCUSD) Trading Strategy: The price structure in the downtrend continues. Also, the price is below the MA200. But even so Wave 5 is the last wave in a Motive wave pattern warning before changing the trend, So wait a wave 5 complete to find the trade setup.
Bitcoin/U.S. Dollar(BTCUSD) Technical Indicators: The price is above the MA200 indicating an uptrend. MACD, and RSI bearish momentum.
More By This Author:
Elliott Wave Technical Analysis : Tron/USD, Monday, September 4
Elliott Wave Technical Analysis: Texas Instruments Inc. - Friday, Sep. 1
Day Chart Elliott Wave Technical Analysis: AUD/JPY - Friday, September 1


Comments
Log in or sign up to join the conversation.