Elliott Wave Technical Analysis : Tron/USD, Monday, September 4
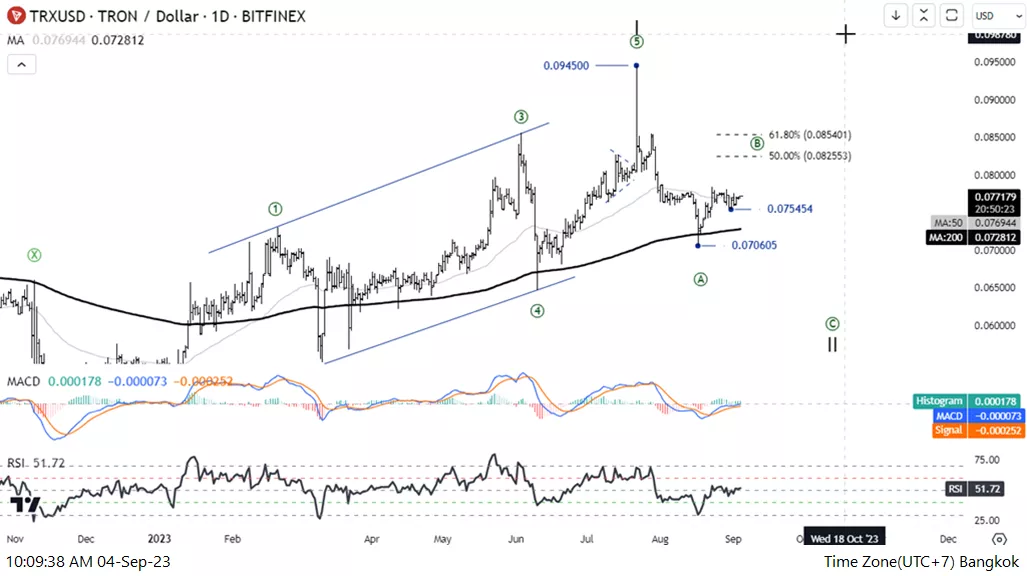
Elliott Wave Analysis TradingLounge Daily Chart, 4 September 23,
Tron/U.S. dollar(TRXUSD)
TRXUSD Elliott Wave Technical Analysis
Function: Counter trend
Mode: Corrective
Structure: Zigzag
Position: Wave ((B))
Direction Next higher Degrees: wave II of Impulse
Wave Cancel invalid Level: 0.045
Details: a Short-term pull back of wave ((B)) before Lower in wave ((C))
Tron/U.S. dollar(TRXUSD)Trading Strategy: A fall from 0.0945 with a five-wave pattern is Important evidence that Shows a Downtrend, And a rise in three-wave from 0.07605 indicates downtrend is not complete. So Overview the price still a downtrend and this pullback may be short-term for continuing down
Tron/U.S. dollar(TRXUSD)Technical Indicators: The price is above the MA200 indicating an Uptrend, MACD and RSI bearish momentum.
(Click on image to enlarge)

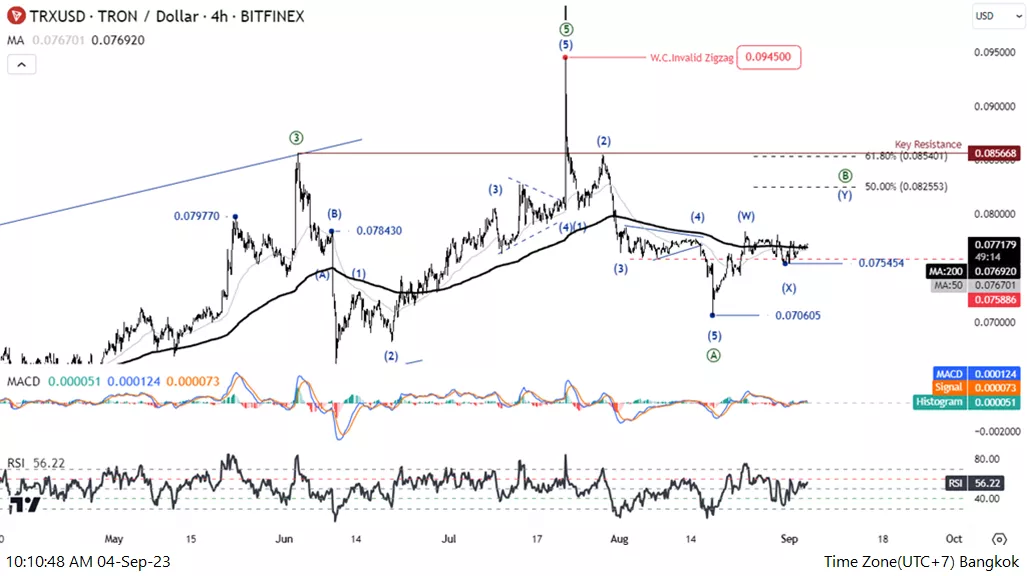
Elliott Wave Analysis TradingLounge 4H Chart, 4 September 23,
Tron/U.S. dollar(TRXUSD)
TRXUSD Elliott Wave Technical Analysis
Function: Counter trend
Mode: Corrective
Structure: Zigzag
Position: Wave ((B))
Direction Next higher Degrees: wave II of Impulse
Wave Cancel invalid Level: 0.045
Details: a Short-term pull back of wave ((B)) before Lower in wave ((C))
Tron/U.S. dollar(TRXUSD)Trading Strategy: A fall from 0.0945 with a five-wave pattern is Important evidence that Shows a Downtrend, And a rise in three-wave from 0.07605 indicates downtrend is not complete, So Overview the price still a downtrend and this pullback may be short-term for continuing down
Tron/U.S. dollar(TRXUSD)Technical Indicators: The price is above the MA200 indicating an Uptrend, MACD and RSI bearish momentum.
(Click on image to enlarge)

More By This Author:
Elliott Wave Technical Analysis: Texas Instruments Inc. - Friday, Sep. 1
Day Chart Elliott Wave Technical Analysis: AUD/JPY - Friday, September 1
Elliott Wave Technical Analysis 4 Hour Chart - Australian Dollar/Japanese Yen
Analyst Peter Mathers TradingLounge™ Australian Financial Services Licence - AFSL 317817


