

Image Source: Pixabay
Texas Instruments Inc., Elliott Wave Technical Analysis
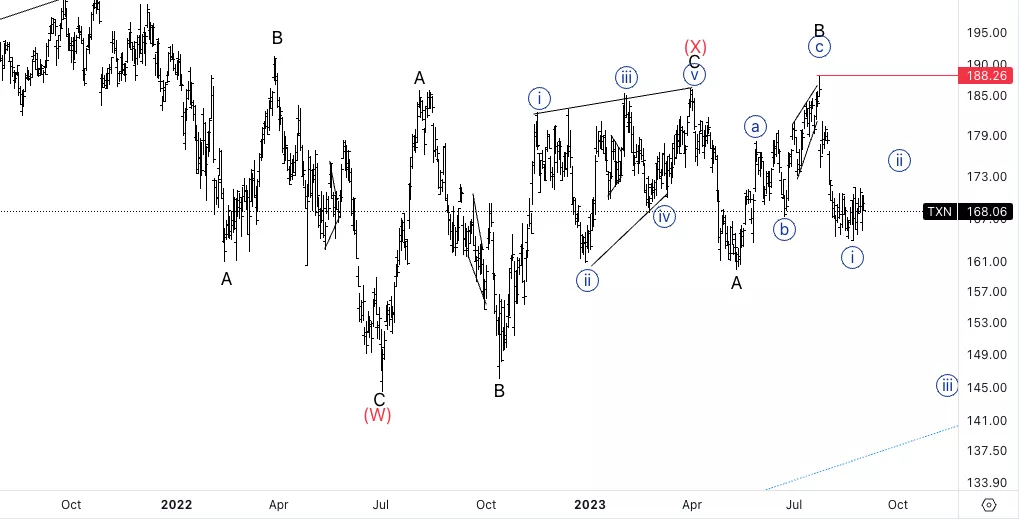
Texas Instruments Inc., (Nasdaq: TXN): Daily Chart 1 September 2023
TXN Stock Market Analysis: We have been looking for a potential five wave move to the downside into what could be wave {i} of a much larger correction, to be in place. It looks like we are trying to pullback to then resume lower.
TXN Elliott Wave Count: Wave {ii} of C.
TXN Technical Indicators: Below all averages.
TXN Trading Strategy: Looking for further upside into wave {ii} before continuing lower.
Analyst: Alessio Barretta
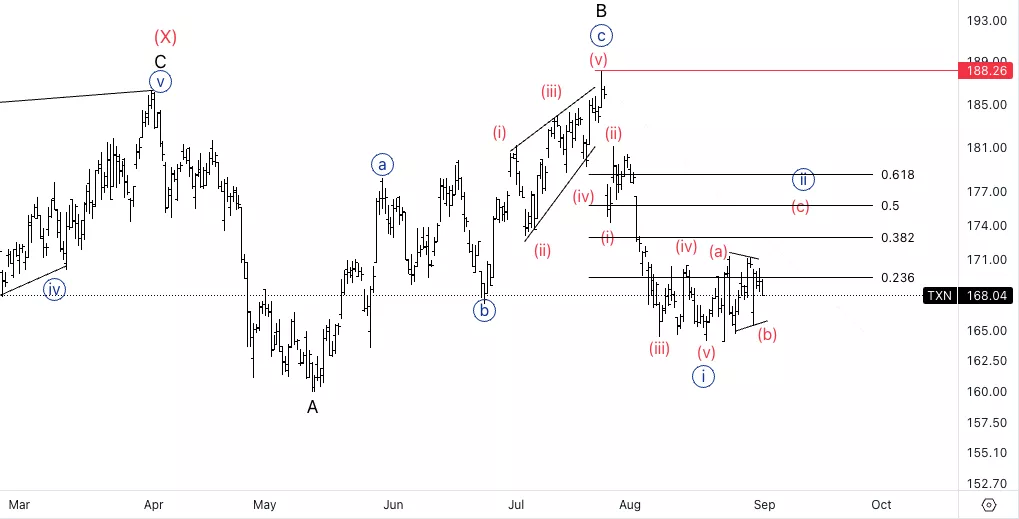
Texas Instruments Inc., TXN: 4-hour Chart 1 September 2023
Texas Instruments Inc., Elliott Wave Technical Analysis
TXN Stock Market Analysis: ON the lower time frames it looks like we could be moving sideways into a triangle in wave (b) to then resume higher into wave (c) to around 50-61% of the previous advance.
TXN Elliott Wave count: Wave (b) of {ii}.
TXN Technical Indicators: 20EMA as support.
TXN Trading Strategy: Look for shorts at the end of {ii}.
More By This Author:
Elliott Wave Technical Analysis Day Chart: British Pound/Japanese Yen
Elliott Wave Technical Analysis: Zscaler Inc. - Thursday, Aug. 31
Elliott Wave Technical Analysis 4 Hour Chart: British Pound/Japanese Yen


Comments
Log in or sign up to join the conversation.