

Image Source: Unsplash
Zscaler Inc., Elliott Wave Technical Analysis
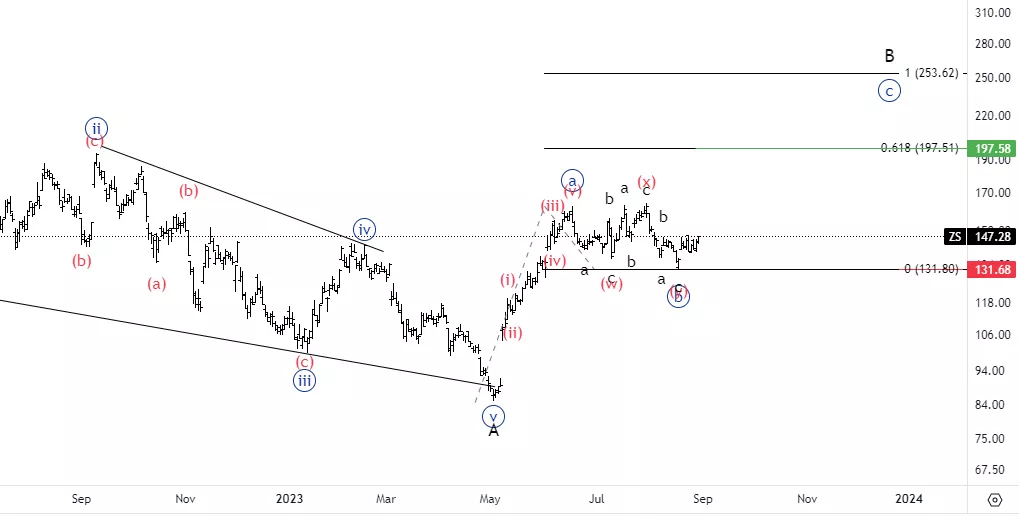
Zscaler Inc., (Nasdaq: ZS): Daily Chart, 31 August 2023
HON Stock Market Analysis: We have been looking for upside resumption for a while, as this sideways consolidation seems to be corrective in nature. As longs as we do not break the current low at 136.1$ we could see further upside.
ZS Elliott Wave Count: Wave {c} of A.
ZS Technical Indicators: 20EMA as support.
ZS Trading Strategy: Looking for longs into wave {c}.
Analyst: Alessio Barretta
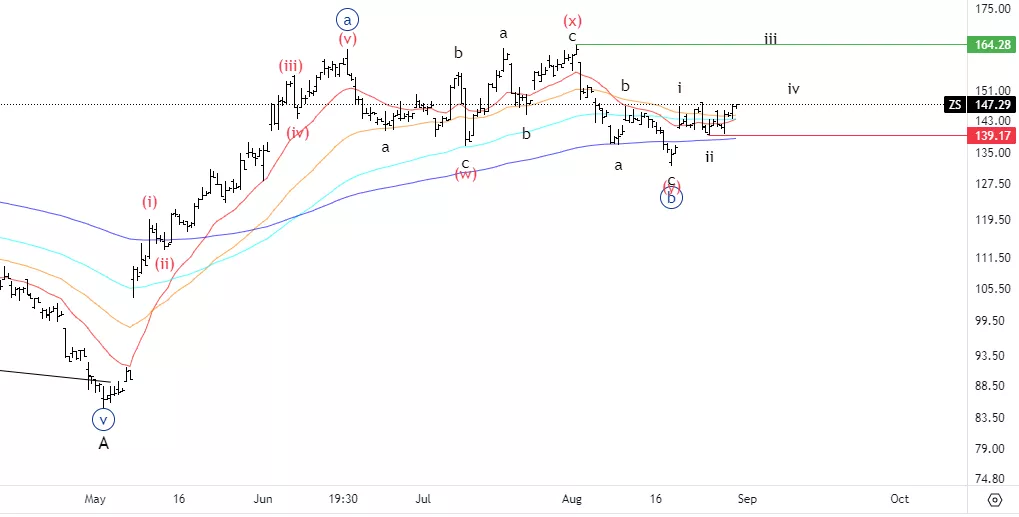
Zscaler Inc., ZS: 4-hour Chart 31 August 2023
Zscaler Inc., Elliott Wave Technical Analysis
ZS Stock Market Analysis: On the lower picture it looks like we could be due at least one more leg to the upside into either a wave iii or c. That could represent a very short term trade setup, as there is also support on the averages.
ZS Elliott Wave count: Wave (i) of {c}.
ZS Technical Indicators: Above all averages.
ZS Trading Strategy: Looking for short term longs into wave iii or c.
More By This Author:
Elliott Wave Technical Analysis Day Chart: British Pound/Japanese Yen
Elliott Wave Technical Analysis 4 Hour Chart: British Pound/Japanese Yen
Elliott Wave Technical Analysis: Bitcoin, Thursday, Aug. 31


Comments
Log in or sign up to join the conversation.