Day Chart Elliott Wave Technical Analysis: AUD/JPY - Friday, September 1
AUDJPY Elliott Wave Analysis Trading Lounge Day Chart, 1 September 23
Australian Dollar / Japanese Yen (AUDJPY) Day Chart
AUDJPY Elliott Wave Technical Analysis
Function: Counter Trend
Mode: impulsive
Structure:Red wave 3 of C
Position: Blue wave C
Direction Next lower Degrees: wave (3 ) of Motive continue
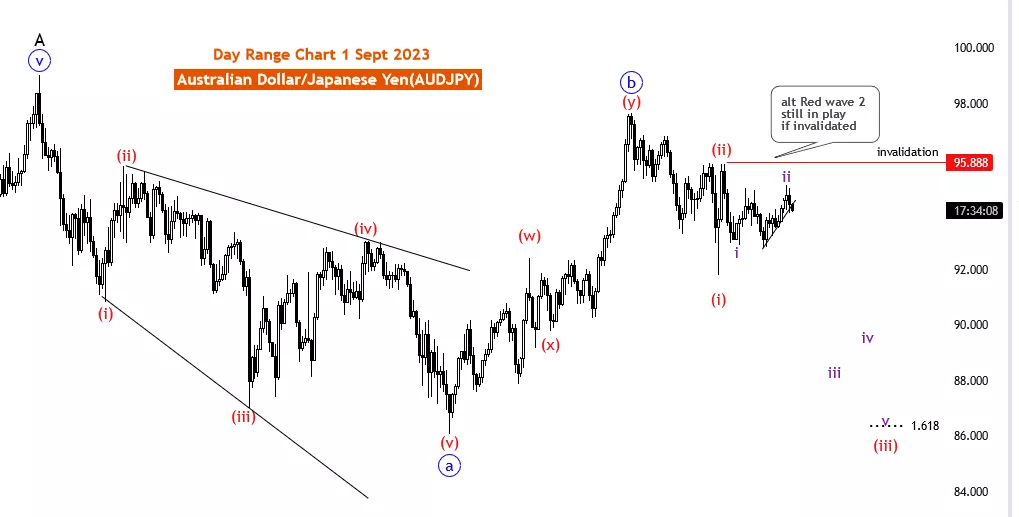
Details: After red corrective wave 2 now wave red wave 3 in play,and red wave 3 likely to end at fib level 1.618 . Wave Cancel invalid level:95.888
The AUDJPY Elliott Wave Analysis for 1 September 23, focuses on the day chart of the Australian Dollar/Japanese Yen currency pair, providing a detailed examination of the price movement using the Elliott Wave theory.
The Function is identified as Counter Trend, suggesting the potential for a reversal in the prevailing trend. Traders paying attention to this function may consider trading strategies that go against the current trend.
The Mode is described as impulsive, indicating that the price movement is characterized by strong and forceful directional shifts. This information can help traders anticipate significant price momentum.
The Structure is defined as Red wave 3 of C, providing insight into the specific wave within the broader Elliott Wave sequence. This level of detail allows traders to better understand the ongoing market dynamics.
The Position is marked as Blue wave C, which indicates the current phase of the wave count and its alignment within the broader Elliott Wave pattern. This knowledge aids traders in identifying potential turning points or trends.
The Direction Next Lower Degrees points to wave (3) of Motive continue, highlighting the continuation of the ongoing impulsive move at a lower degree. This guidance is valuable for traders aiming to align their strategies with the projected market direction.
The analysis mentions that after the completion of the red corrective wave 2, the red wave 3 is now in play. The prediction that the red wave 3 is likely to end at the fib level 1.618 indicates a potential target for the current impulsive move.
The Wave Cancel invalid level is specified as 95.888, serving as a reference point for traders to assess the validity of their analysis and adjust their strategies accordingly.
In conclusion, the AUDJPY Elliott Wave Analysis for 1 September 23, provides traders with a comprehensive perspective of the market using Elliott Wave theory. By exploring the Function, Mode, Structure, Position, Direction, and key wave levels, traders gain a deeper understanding of the market's potential movements. However, traders are advised to complement this analysis with other technical and fundamental indicators to make informed trading decisions and apply effective risk management strategies.
(Click on image to enlarge)

More By This Author:
Elliott Wave Technical Analysis Day Chart: British Pound/Japanese Yen
Elliott Wave Technical Analysis: Zscaler Inc. - Thursday, Aug. 31
Elliott Wave Technical Analysis 4 Hour Chart: British Pound/Japanese Yen
Analyst Peter Mathers TradingLounge™ Australian Financial Services Licence - AFSL 317817


