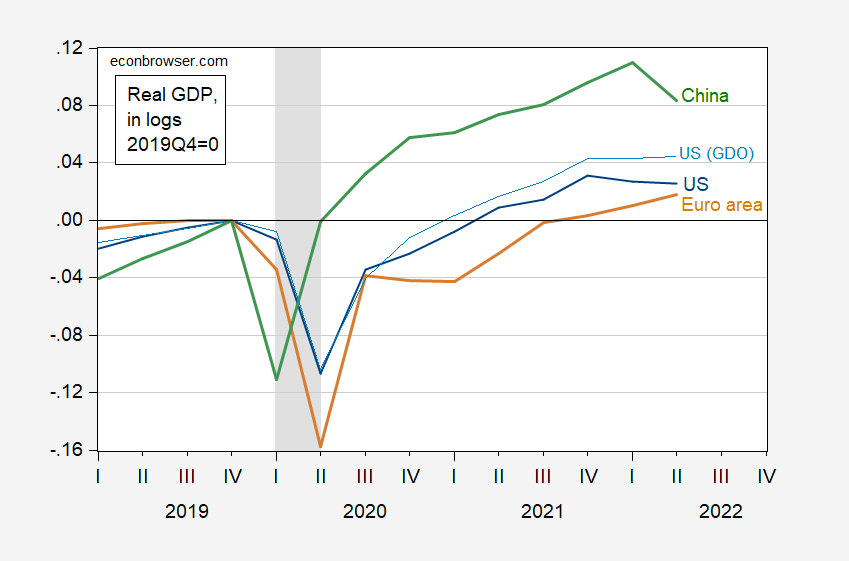
US, Euro Area And China GDP Over The Pandemic And Recovery
Following up on the last post, here is a graph of three major economies.
Figure 1: Real GDP for the US (blue), for Euro area (tan), for China (green), and GDO for the US (light blue), all in logs, 2019Q4=0. NBER defined peak-to-trough recession dates for the United States shaded gray. Source: BEA, Eurostat, via FRED, China NBS, NBER, and author’s calculations.
At current exchange rates, these three economies account for about 60% of the world GDP (China is about 20%, US about 25%).
The sharp drop in Chinese GDP in Q2 highlights the threat to global economic output posed by the Chinese government’s current approach to dealing with the pandemic.
More By This Author:
Weekly Economic Activity through September 10th
Hurricane Maria and Puerto Rico 5 Years Later
Did US Inflation Accelerate Relative To Euro Area?


