
Now seems a useful time to re-assess some of the pronouncements made in the wake of the tragic disaster that struck Puerto Rico in September 2017. First, fatalities of Americans (contra Mr. Trump’s seeming assertion these were not American) were much higher than some commentators claimed. Second, arguments that economic policies undertaken in 2016 and 2017 (i.e., the austerity measures associated with PROMESA) caused more deaths than Hurricane Maria are incorrect. Finally, the economic challenges that existed before the hurricane struck — including insufficient tax revenues — remain, even as the economy has rebounded.
The Impact on Excess Mortality
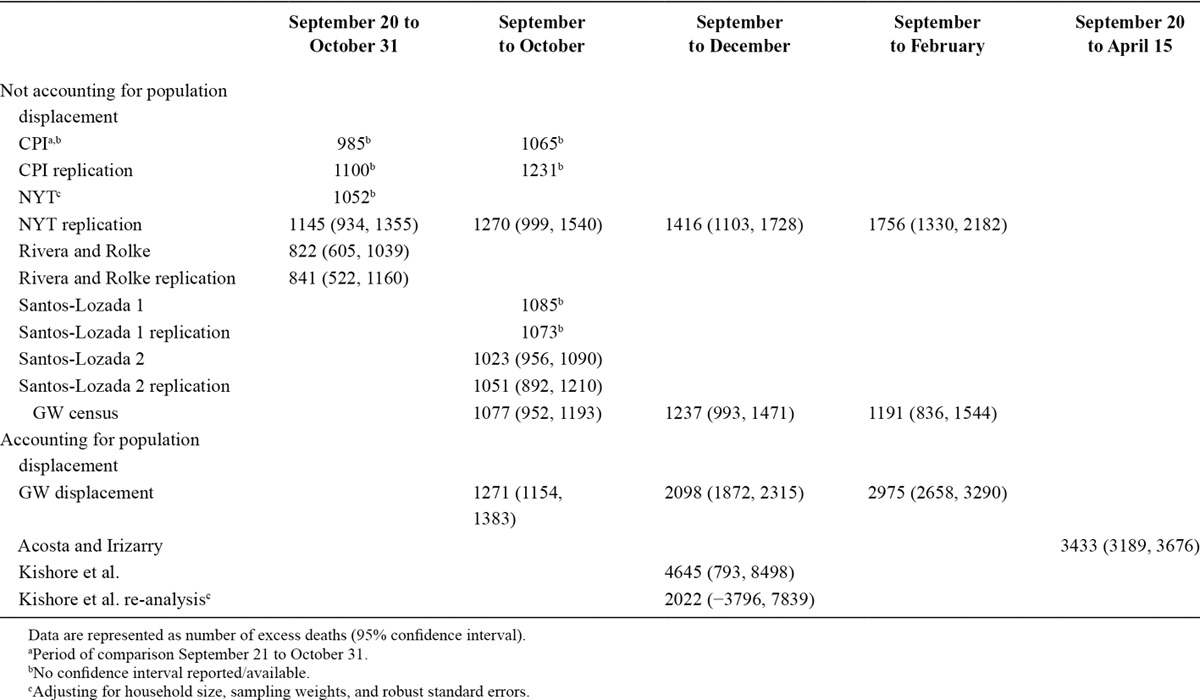
First, let’s recall that some commentators argued in the wake of the Hurricane that no more than 200-400 deaths occurred. Even after being tutored in terms of what the data meant, some continued to provide unrealistically low estimates.
From Sandberg, et al. (July 2019) in Epidemiology:
Now compare against shoot-from-the-hip comments on Econbrowser, such as this from Steven Kopits on 5/31/2018:
Excess deaths in PR through year end, those recorded by the Statistics Office, numbered only 654. Most of these occurred in the last ten days of September and the whole of October. While the power outages there were exacerbated by the state ownership of PR’s utility, a large portion of the excess deaths would likely have occurred regardless, given the terrain and the strength of the hurricane. Thus, perhaps 300-400 of the excess deaths would have occurred regardless of steps anyone could have made to fix the power supply. The remainder can be attributed essentially to the state ownership of the power utility.
I would note that excess deaths fell by half in December. Thus, the data suggests that the hurricane accelerated the deaths of ill and dying people, rather than killing them outright. I would expect the excess deaths at a year horizon (through, say, Oct. 1, 2018) to total perhaps 200-400. Still a notable number, but certainly not 4,600. [emphasis added-MDC]
Mr. Kopits’ updated (6/4) analysis concludes, even with updated data:
Thus, the year-end excess death toll of 1,400 may be treated as a firm number in practice.
I think “firm” is an adjective to be avoided in these situations. Here is a graph presenting selected estimates, from this April 2019 post, which includes some of the earlier estimates.
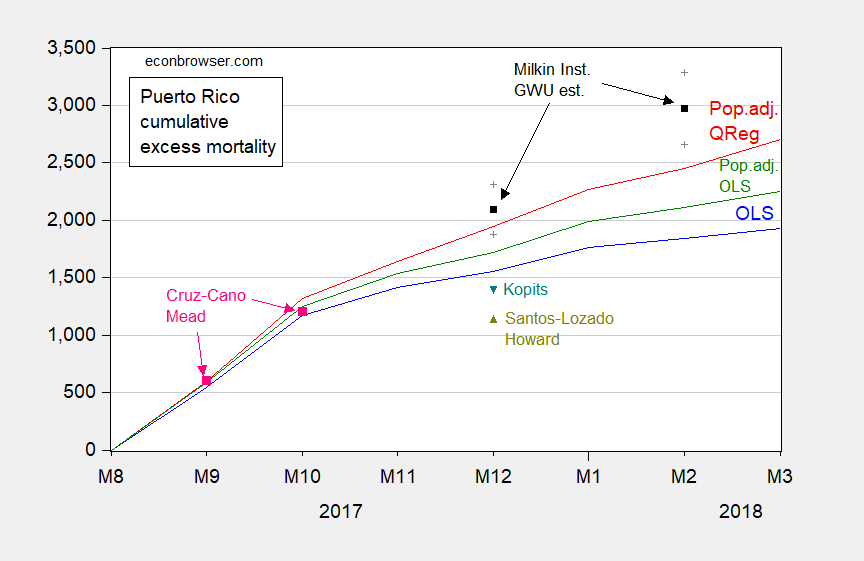
Figure 1: Cumulative excess deaths from September 2017, for simple time dummies OLS model (blue), OLS model adjusting for population (green), and Quantile Regression model adjusting for population (red), Milken Institute point estimate (black square) and 95% confidence interval (gray +), Santos-Lozada, Howard letter (chartreuse triangle), Cruz-Cano and Mead (pink squares), Kopits (teal triangle). Not pictured: Kopits estimate of 300-400 for October 2018. Source: author’s calculations, Milken Institute (2018), Santos-Lozada and Howard (2018), Cruz-Cano and Mead (2019), and Kopits (2018).
Austerity Killed More than the Hurricane?
What about arguments that austerity measures associated with PROMESA caused more excess mortality than the hurricane [extensive argument here] . In order to assess this argument, first consider mortality data through February 2018.
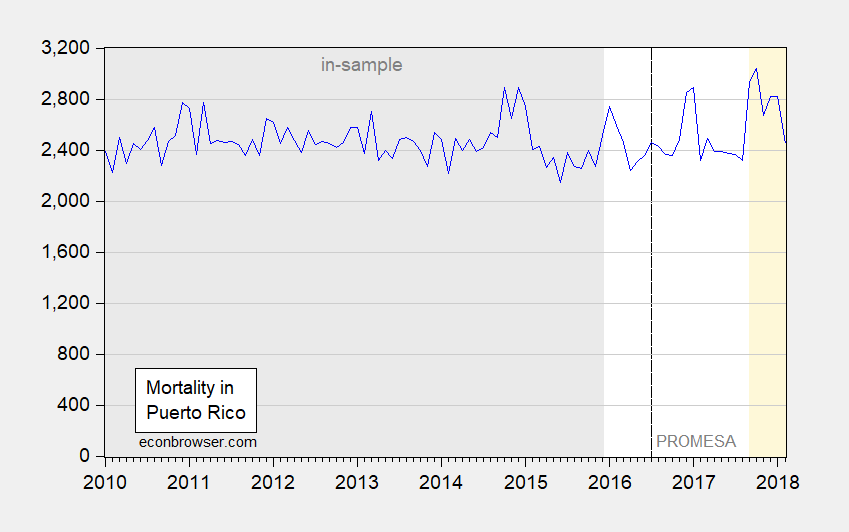
Figure 2: Mortality per month (blue). Gray denotes in-sample period; orange shading denotes Hurricane Maria and post-hurricane period; dashed line at PROMESA legislation. Source: Santos-Lozada and Howard, 2017, June release of Vital Statistics data.
Second, now consider constructing the counterfactual not incorporating austerity measures both before and after PROMESA implementation (legislation passed as of in July 2016, control in effect as of October 2016). I accomplish this by estimating two equations: (1) a simple averaging over the 2010-2015 period, and (2) a log-log OLS regression specification incorporating population estimates (as well as a dummy for October 2014). 2016 seems an appropriate break point for austerity given Brad Setser’s discussion of Puerto Rican finances. These specifications are discussed in this post. I show in Figure 3 the implied excess mortality figures.
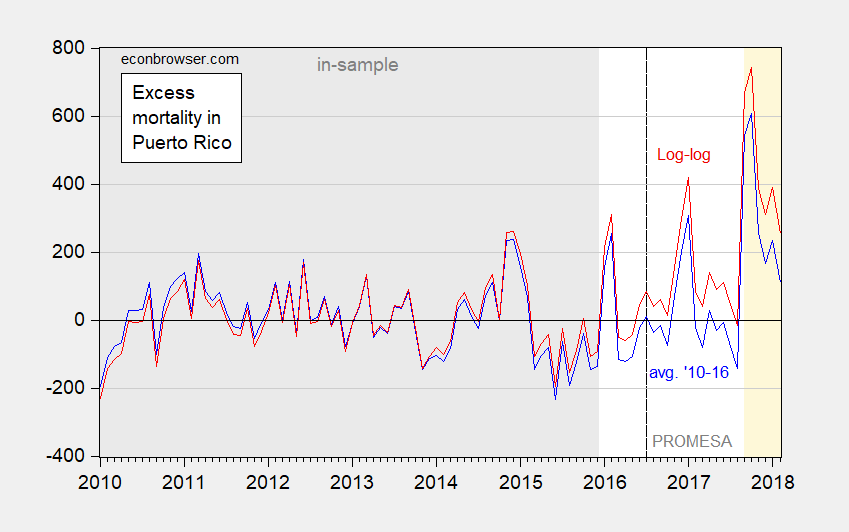
Figure 3: Excess mortality per month calculated using averages 2010-15 (blue), and population adjusted using 2010-15 sample (red), population is cubic interpolation from IMF World Economic Outlook database data. Gray denotes in-sample period; orange shading denotes Hurricane Maria and post-hurricane period; dashed line at PROMESA legislation. Source: Santos-Lozada and Howard, 2017, June release of Vital Statistics data, IMF WEO April 2018 database, and author’s calculations.
Notice in neither case are most of the pre-Maria deviations statistically significant at the 10% msl. In other words, one could not typically reject the null hypothesis of no austerity-induced excess mortality, pre-Maria.
Third, it’s instructive to consider excess mortality from 2016M01-2017M08, and how it compares to excess mortality to that 2017M09-2018M02. If one assumes zero population change from 2016-17, then one gets the estimate of cumulative deaths (“avg. ’10-’16”) in red line, which indicates minimal impact of austerity.

Figure 4: Cumulative excess mortality per month using population adjustment specification (blue) using cubic interpolation of IMF World Economic Outlook database data, and using 2010-15 average (red). Orange shading denotes Hurricane Maria and post-hurricane period; dashed line at PROMESA legislation. Source: Santos-Lozada and Howard, 2017, June release of Vital Statistics data, IMF WEO April 2018 database, and author’s calculations.
However, the more realistic assessment relies upon adjusting the counterfactual for population. This leads to the blue line, labeled “log-log”), seemingly verifying the proposition that excess deaths began before the hurricane made landfall. However, interestingly, neither approach directly contradicts the point that most of the excess mortality since 2016M01 is due to the impact of Hurricane Maria.
I conclude that using statistical analysis, the inference that excess deaths due to pre- and post-Maria austerity exceed that of the aftermath of Hurricane Maria is extremely fragile.
Buttressing this view, I also find that, using electricity grid outage data reported in Shermeyer (2018), excess mortality as calculated using a population adjustment matches very closely outage data, derived either from PERPA (the public utility) or from Suomi National Polar-orbiting Partnership Visible Infrared Imaging Radiometer Suite (NPP VIIRS).
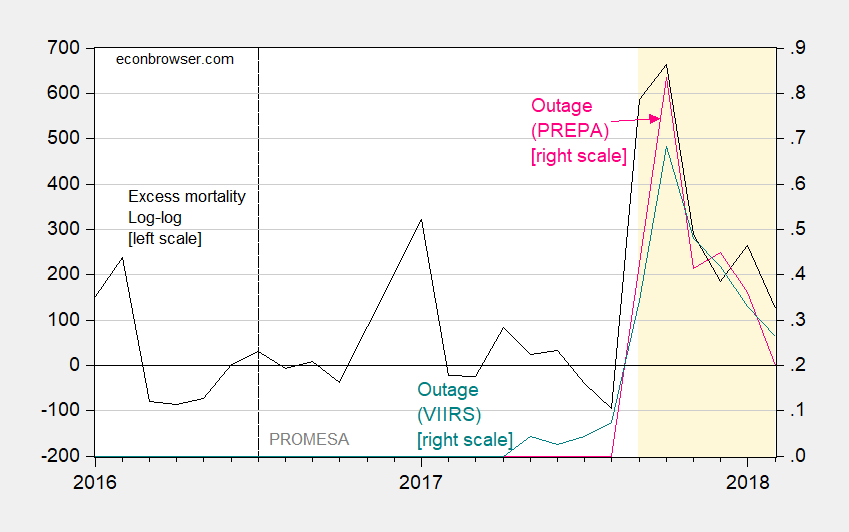
Figure 5: Excess mortality per month using population adjustment specification (black) using cubic interpolation of IMF World Economic Outlook database data, and electricity outages as proportion of total, from PREPA (pink) and from VIIRS as reported in Shermeyer (2018). Orange shading denotes Hurricane Maria and post-hurricane period; dashed line at PROMESA legislation. Source: Santos-Lozada and Howard, 2017, June release of Vital Statistics data, IMF WEO April 2018 database, personal communication from Jacob Shermeyer, and author’s calculations.
A regression over the 2007M04-2018M02 period, the slope coefficient on outage is 826 using Puerto Rico Electric Power Authority (PREPA) data, and 950 using VIIRS data, both statistically significant using HAC robust errors, with adjusted R2 = 0.83 and 0.72, respectively. That means 639-690 excess mortality attributable to power outages (and correlates) in October, for instance. (The excess mortality could be due directly to electricity outages, or due to communication outages and water service breakdowns correlated with the electricity outages.)
Exactly how bad was the Federal response to Maria in Puerto Rico?
Skipping the optics of paper towels, several reports (e.g., DHS OIG) have document exactly how poorly FEMA performed. In addition, academic analyses have documented the differential response that occurred in the same period — that is much larger responses to hurricane landfalls in Texas and Florida.
The economic outlook
After the catastrophic disaster response failure, the Puerto Rican economy recovered to pre-hurricane levels, only to be laid low by the Covid pandemic. Figure 6 below shows GDP and the Economic Activity Index.

Figure 6: GDP in mn Ch2012$ (blue bar, left log scale), and Economic Activity Index (EDB-EAI) s.a. (blue, right log scale). NBER defined peak-to-trough recession dates shaded gray. Source: BEA, Economic Development Bank for Puerto Rico, and NBER.
The broadest measure of activity — GDP — is only reported up through 2020, while the Economic Activity Index –based on employment, electricity generation, gasoline consumption and cement sales — which extends to August 2022 only measures part of the economy. As shown, while there is a rebound, in (measured) economic activity, it’s tailed off in recent months. This pattern shows up in civilian employment (although not in series from the establishment series).

Figure 7: Puerto Rico nonfarm payroll employment (blue), private nonfarm payroll employment (tan), civilian employment (green), all in 000’s, s.a.. NBER defined peak-to-trough recession dates shaded gray. Source: BLS, and NBER.
Federal assistance associated with the pandemic is ending. This fiscal drag adds to the central long term challenges of an uncompetitive economy (in part due to shipping and other transportation regulations) and a large government debt mired in restructuring (see CRS). See also Gregory Makoff and Brad Setser’s 2017 economic analysis.
Some of these challenges are intractable, while other could be relatively easily remedied. For instance, waiving the Jones Act for Puerto Rico would in some estimates lower prices by $1 billion, which is substantial for an economy measured at about $103 billion in 2020.
More By This Author:
Did US Inflation Accelerate Relative To Euro Area?PPI in August, And Possible Implications For The CPI
Inflation In August


Comments
Log in or sign up to join the conversation.