
Yes, for core, no for headline:
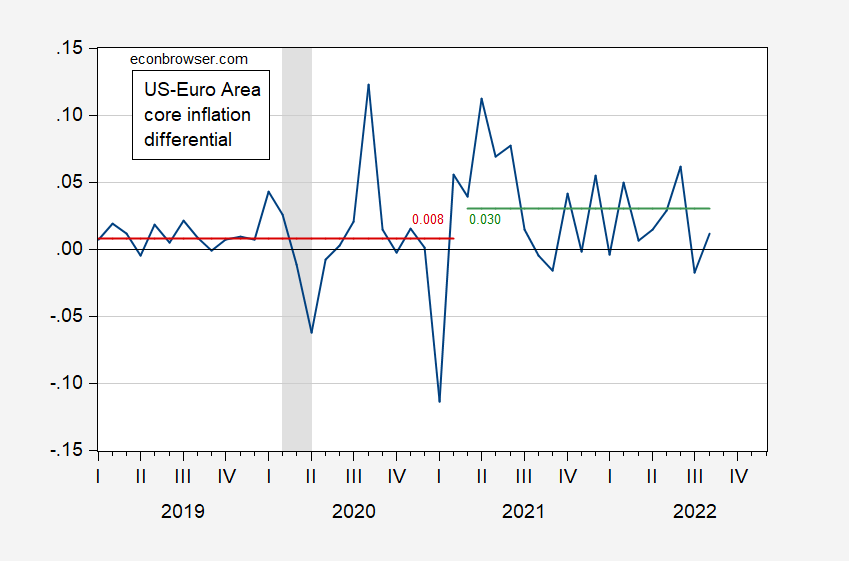
Figure 1: US-Euro Area month-on-month annualized core inflation differential (blue), 2019-2021M02 average (red), 2021M03-2022M08 average (green). Inflation calculated as log-differences on CPI (US), and HICP (Euro area). HICP seasonally adjusted using Census X-13, log transform, X-11 adjustment. NBER defined peak-to-trough recession dates shaded gray. Source: BLS, Eurostat via FRED, NBER, and author’s calculations.
US core inflation post-ARP rose significantly higher than Euro Area — 2.2 percentage points, statistically significant at the 10% level. One could interpret this as an excessively aggressive stimulus; alternatively one could consider the Euro area recovery packages as insufficiently aggressive. In other words, it’s not as if we didn’t get something with the additional inflation.
In the end, in terms of the inflation that consumers face, the Euro Area experienced the same acceleration in inflation that the US did. This is shown in the corresponding graph of headline inflation differentials.
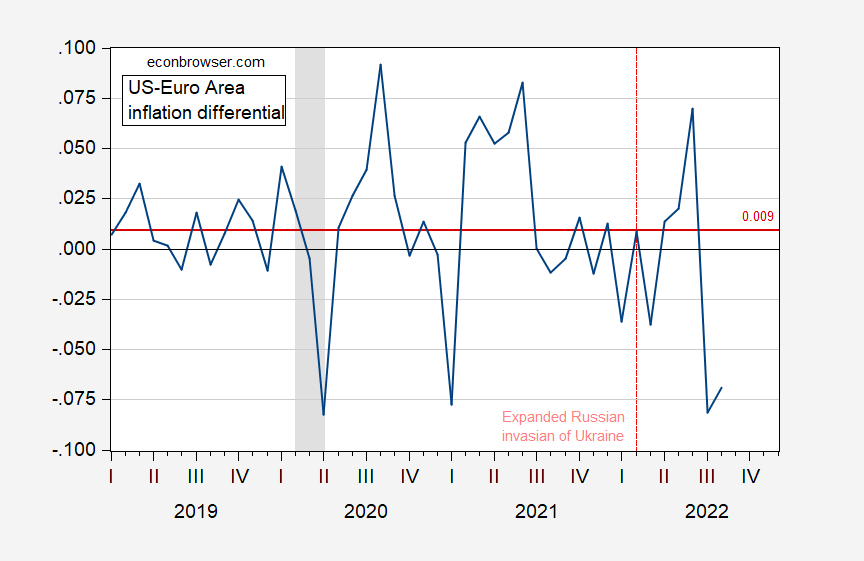
Figure 2: US-Euro Area month-on-month annualized inflation differential (blue), 2019-2022M08 average (red). Inflation calculated as log-differences on CPI (US), and HICP (Euro area). HICP seasonally adjusted using Census X-13, log transform, X-11 adjustment. NBER defined peak-to-trough recession dates shaded gray. Source: BLS, Eurostat via FRED, NBER, and author’s calculations.
Euro area inflation rose relative to US with the jump in natural gas prices starting in June/July 2021. If one checked for a change in the differences at 2021M07, one would find Euro area inflation accelerated 1.4 percentage points (statistically significant at the 10% level).
It’s interesting to see what this means for the levels of consumer prices. Normalizing to 2021M03 (passage of ARP), we have the following.
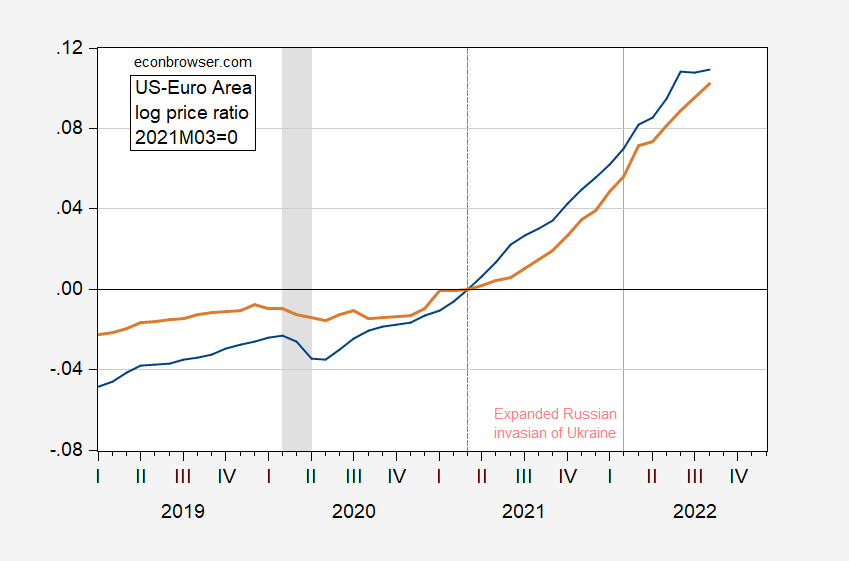
Figure 3: US-Euro Area log price level (blue). HICP seasonally adjusted using Census X-13, log transform, X-11 adjustment. NBER defined peak-to-trough recession dates shaded gray. Source: BLS, Eurostat via FRED, NBER, and author’s calculations.
More By This Author:
PPI in August, And Possible Implications For The CPI
Inflation In August
Weekly Indicators Of Economic Activity Through September 3


Comments
Log in or sign up to join the conversation.