PPI In August, And Possible Implications For The CPI
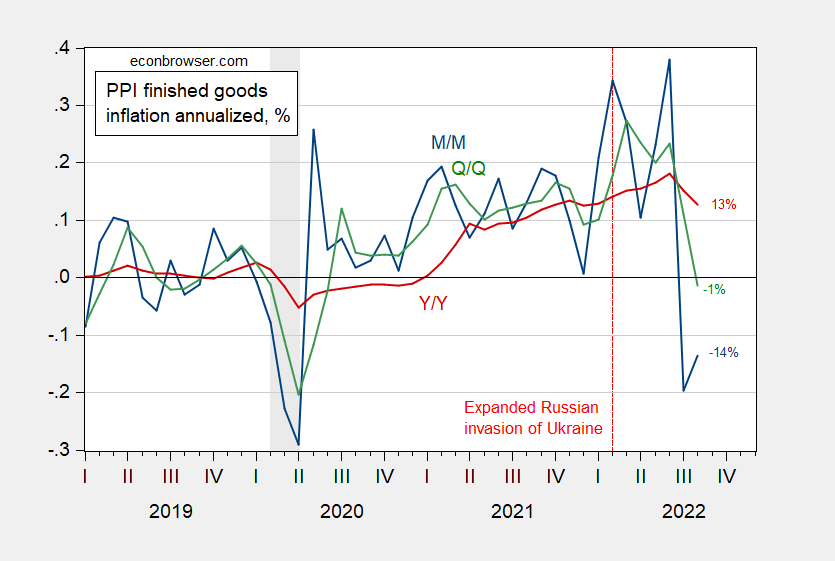
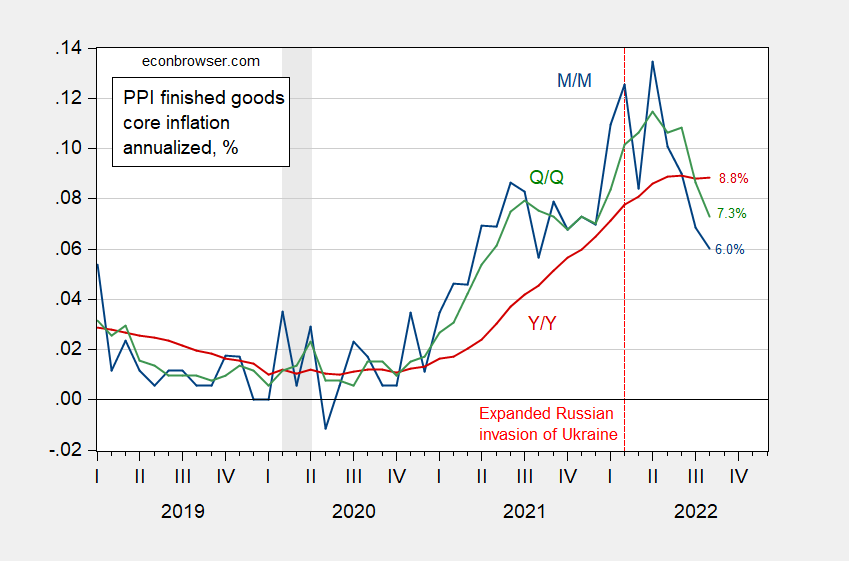
M/M PPI at Bloomberg consensus, core slightly above. At the m/m, q/q and y/y horizons.
Figure 1: Month-on-month annualized PPI (final demand) inflation (blue), Quarter-on-quarter (green), year-on-year (red), %. NBER defined recession dates peak-to-trough shaded gray. Source: BLS, NBER and author’s calculations.
Figure 2: Month-on-month annualized core PPI (final demand) inflation (blue), Quarter-on-quarter (green), year-on-year (red), %. NBER defined recession dates peak-to-trough shaded gray. Source: BLS, NBER and author’s calculations.
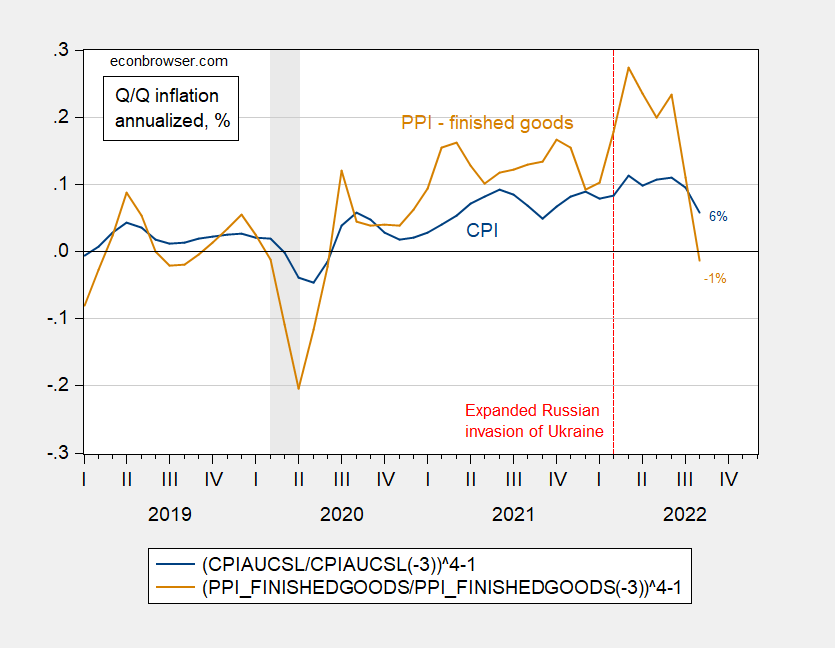
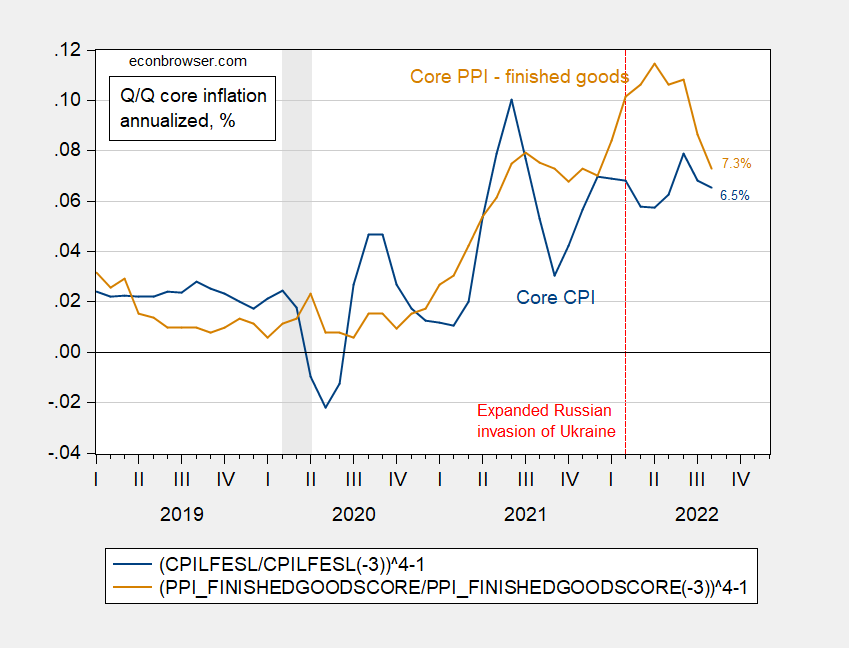
Does the PPI lead the CPI? Some pictures.
Figure 3: Quarter-on-quarter CPI (blue), PPI finished goods (tan), %. NBER defined recession dates peak-to-trough shaded gray. Source: BLS, NBER and author’s calculations.
Figure 4: Quarter-on-quarter core CPI (blue), core PPI finished goods (tan), %. NBER defined recession dates peak-to-trough shaded gray. Source: BLS, NBER and author’s calculations.
It’s hard to see if PPI leads CPI in any reliable way, by just looking at the pictures (and in any case, important to remember the CPI includes services, while these PPI measures cover only final goods). From my August 2021 post on CPI and PPI:
Do PPI’s lead CPI’s in the US? Clark (1995) provides a skeptical view that PPI’s provide additional systematic predictive power.
Some analysts project that recent increases in prices of crude and intermediate goods will pass through the production chain and generate higher consumer price inflation. While simple economics suggests such a pass-through effect may occur, more sophisticated reasoning and careful consideration of the construction of the PPI and CPI data suggest any pass-through effect may be weak. Consistent with this more sophisticated analysis, the empirical evidence also shows the production chain only weakly links consumer prices to producer prices. PPI changes sometimes help predict CPI changes but fail to do so systematically. Therefore, the recent increases in some producer price indexes do not in themselves presage higher CPI inflation.
Caporale et al. (2002) uses a more formal multivariate approach to conclude that for G-7 economies, PPI’s do lead CPI’s. Whether these findings still pertain in the current environment (and using the updated versions of the PPI) remains to be seen.
More By This Author:
Inflation In AugustWeekly Indicators Of Economic Activity Through September 3
Inflation Breakevens: Common And Uncommon Shocks


