
And other forecasts and nowcasts:
(Click on image to enlarge)
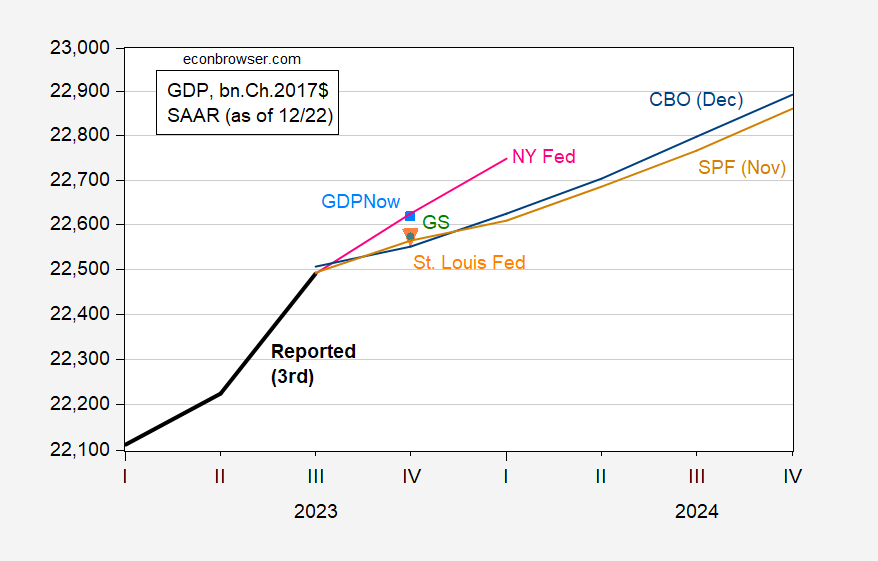
Figure 1: GDP reported (bold black), CBO (blue), SPF (tan), GDPNow (light blue square), Goldman Sachs (green circle), St. Louis Fed news index (orange inverted triangle), all in bn.Ch.2017$ SAAR. Source: BEA 2023Q3 3rd release, CBO Economic Outlook Update (Dec.), Philadelphia Fed (Nov.), Atlanta Fed (12/22), NY Fed (12/22), GS (12/22), St. Louis Fed (12/22), and author’s calculations.
The forecasts seem to be overtaken by events, where Atlanta Fed and NY Fed nowcasts are substantially above forecasts.
More By This Author:
PCE Inflation: Instantaneous Below Target
Business Cycle Indicators with November Employment
Does The Fed Deserve Credit For The Disinflation?


Comments
Log in or sign up to join the conversation.