
With nonfarm payroll employment in November released (+199K vs. +180K consensus), we have the following picture of business cycle indicators followed by the NBER BCDC (plus monthly GDP). The employment series below incorporates the preliminary benchmark revision.
(Click on image to enlarge)
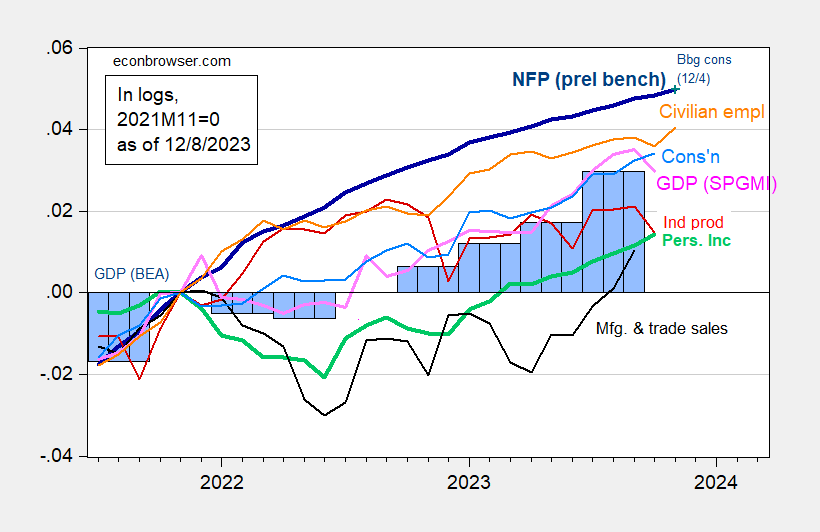
Figure 1: Nonfarm Payroll employment incorporating preliminary benchmark (bold dark blue), implied level using Bloomberg consensus as of 12/4 (blue +), civilian employment (orange), industrial production (red), personal income excluding transfers in Ch.2017$ (bold green), manufacturing and trade sales in Ch.2017$ (black), consumption in Ch.2017$ (light blue), and monthly GDP in Ch.2017$ (pink), GDP, 2nd release (blue bars), all log normalized to 2021M11=0. Source: BLS via FRED, BLS preliminary benchmark, Federal Reserve, BEA 2023Q3 2nd release incorporating comprehensive revisions, S&P Global/IHS Markit (nee Macroeconomic Advisers, IHS Markit) (12/1/2023 release), and author’s calculations.
The employment growth shows continued strength in the economy. The participation rate rose 0.1 ppt to 62.8 (0.1 ppt above consensus), while y/y wage growth of 4.0% was at consensus.
In order to forestall arguments that the standard NFP series has been distorted, it’s of interest to see the trends in other measures of nonfarm payroll employment.
(Click on image to enlarge)
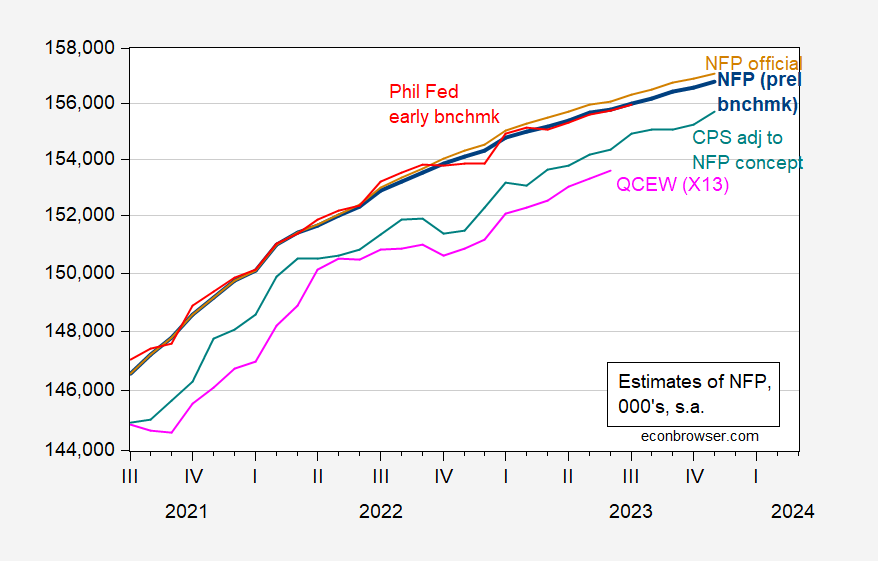
Figure 2: Nonfarm payroll employment (tan), nonfarm payroll employment incorporating preliminary benchmark (bold dark blue), Philadelphia Fed early benchmark (red), CPS civilian employment adjusted to NFP concept (teal), and QCEW total covered employment seasonally adjusted by author using X13 (pink), all in 000’s, s.a. Source: BLS via FRED, Philadelphia Fed, BLS, BLS-QCEW, and author’s calculations.
Census data ends mid-year, so we can’t rely too much on series based on that data to guide us. The BLS’s research series using CPS data adjusted to NFP concept actually rose faster in November than did the CES NFP (3.7% m/m AR vs. 1.5%).
As an aside, as we get more labor market data — including Census based — it becomes more apparent that the labor market, at minimum, was not in a recession in 2022H1 (as some observers have argued).
More By This Author:
Does The Fed Deserve Credit For The Disinflation?
Dispersion In GDP Q3 Tracking
Recession Within The Next 12 Months?


Comments
Log in or sign up to join the conversation.