

Year-on-Year PCE inflation (3.2% in November) is a standard; here’s instantaneous headline and core for comparison (and trimmed mean y/y through October):
(Click on image to enlarge)
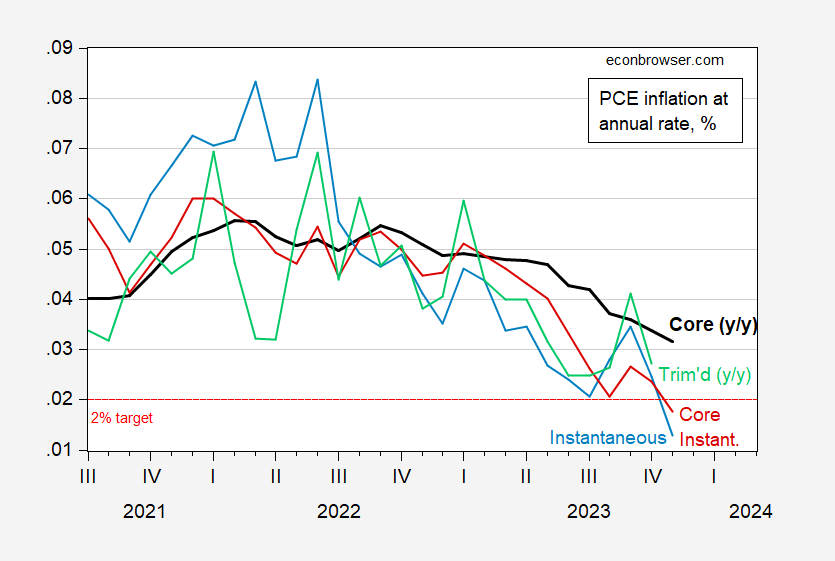
Figure 1: Core PCE inflation, y/y (bold black), instantaneous (T=12,a=4) headline PCE inflation (light blue), instantaneous core PCE (red), both per Eeckhout (2023), trimmed mean y/y (light green), all at annual rates. Source: BEA via FRED, Dallas Fed, and author’s calculations.
As others have noted, PCE and core PCE are at 2% and 1.9% 6 month annualized inflation are at or below target 2%. As Figure 1 shows, Instantaneous measures which upweights recent m/m inflation and downweights older inflation is below 2%.
More By This Author:
Business Cycle Indicators with November Employment
Does The Fed Deserve Credit For The Disinflation?
Dispersion In GDP Q3 Tracking



Comments
Log in or sign up to join the conversation.