

Image Source: Pixabay
Emerging markets, represented by the EEM chart, have been trending lower since October 2024 in what appears to be a complex W-X-Y corrective pattern. Meanwhile, the US Dollar Index (DXY) experienced a strong rally, driven by Trump’s victory in the US elections. However, the rally formed a wedge pattern, which suggests that its upside momentum may be coming to an end.
Why is the correlation between EEM and DXY important? If the Trump administration pushes oil prices lower, inflation expectations could also decline (read more). This would likely lead to lower interest rates, which in turn could weigh on the USD. In such a scenario, capital may flow out of the US and into emerging markets.
Now that EEM is recovering and breaking above a key channel resistance, it signals that bullish momentum is returning. If this trend continues on EEM to 2024 highs, then DXY could decline to the 105–103 range—or possibly even as low as 100.
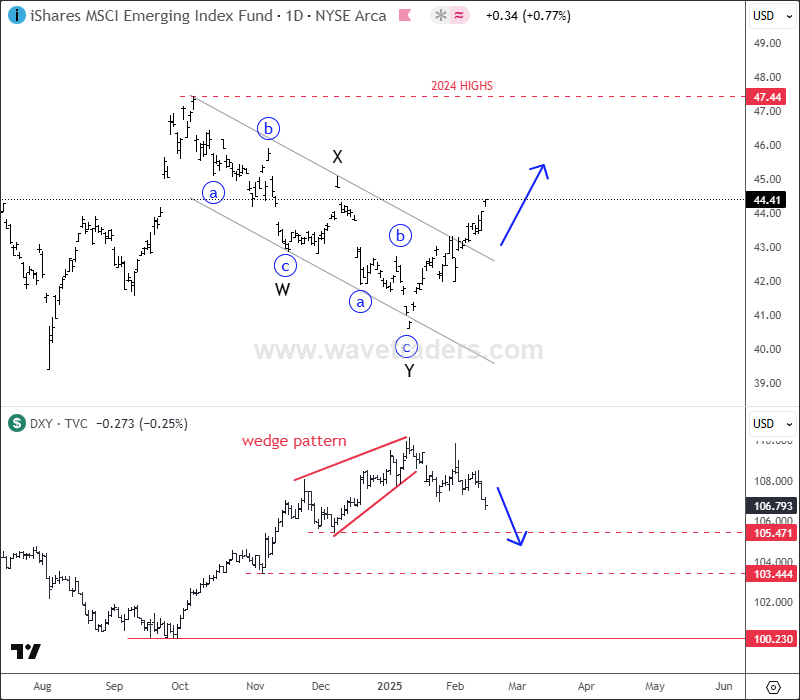
EEM vs. DXY Daily Chart
For more analysis like this, you may want to watch below our latest recording of a live webinar streamed today on February 17 2025. Link here.
More By This Author:
Altcoin Market Is Forming A Lower Degree Bullish Setup
Stellar Slowed Down For A Correction Within Uptrend
Natural Gas Shows Bullish Pattern


Comments
Log in or sign up to join the conversation.