
Natural Gas Shows Bullish Pattern
Photo by American Public Power Association on Unsplash
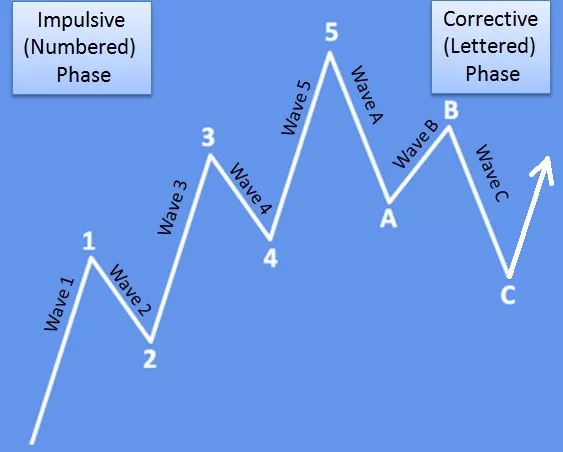
Natural gas looks to be turning bullish after a projected five-wave impulse from the lows, followed by an ABC correction. It gave us a nice bullish setup formation by Elliott Wave theory, so more upside is in view, especially if breaks back above 4.0 bullish confirmation level, just watch out for short-term intraday pullbacks.
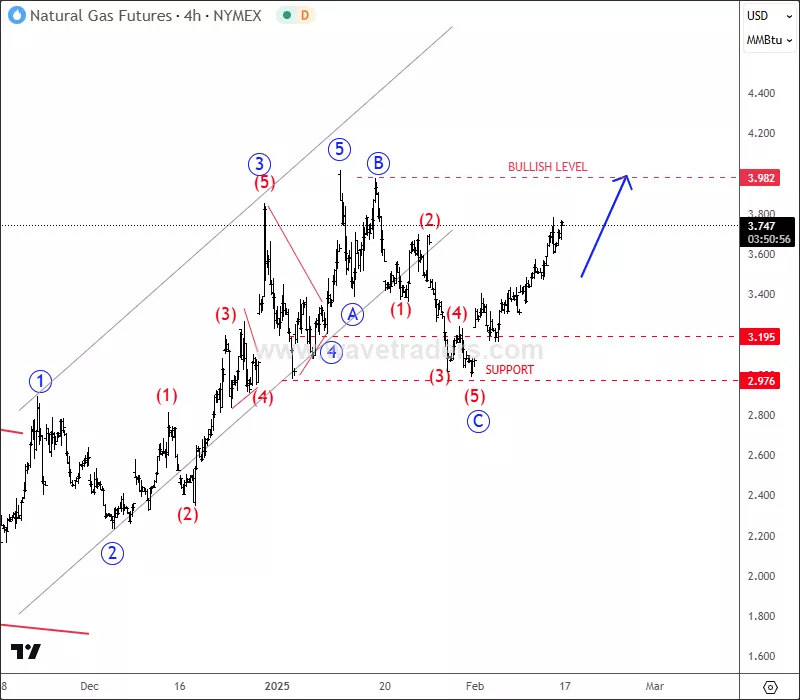
NG 4H Chart
Basic bullish pattern shows that Natural gas may resume its uptrend by Elliott Wave theory.
More By This Author:
AUDJPY Is Recovering After The Wedge Pattern
Crude Oil Outlook: Bearish Pattern, Triangle Formation, And Key Levels To Watch
Stocks And Cryptos Have Space For More Gains
For more analysis like this, you may want to watch below our latest recording of a live webinar streamed on February 10 2025. Link more


