
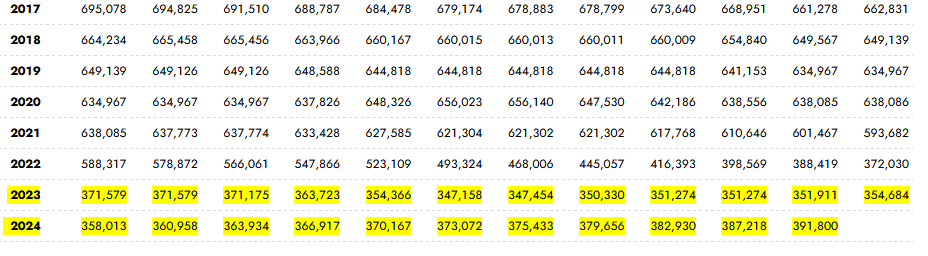
Back in January, despite strong rise, crude oil has seen limited upside and fully reversed the path. This is partly due to the Trump administration’s goal of bringing crude oil prices lower, with plans to refill the US strategic reserves. In fact data from the Energy Information Administration, showing that production has been gradually increasing since summer of 2023, around the time energy prices hit a swing high near $95. Since then, crude oil has consistently formed lower swing highs.
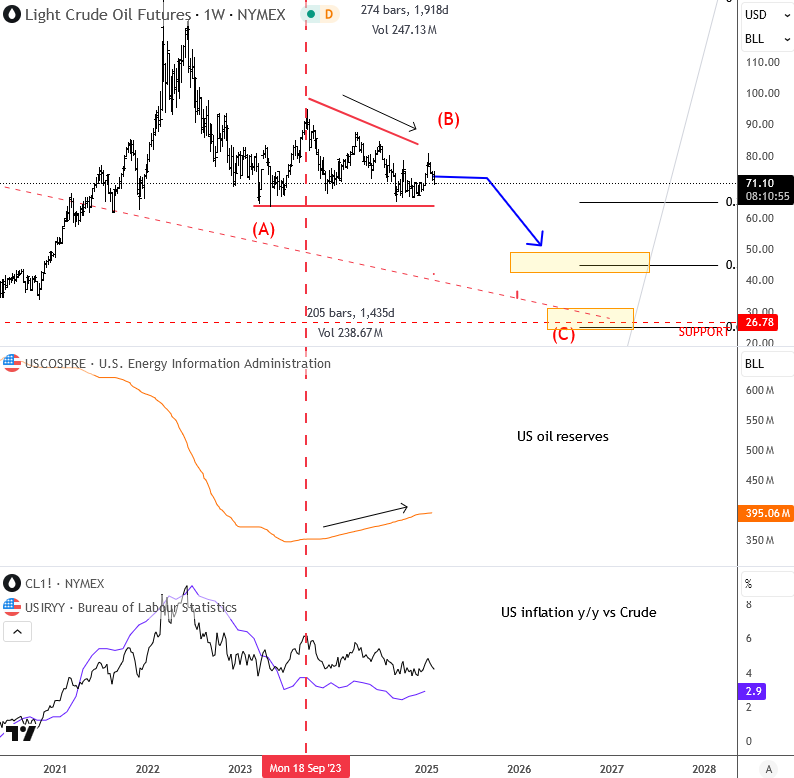
So, if the Trump administration will really boost the oil production, it will likely put more downward pressure on energy prices and help ease inflation; the CPI y/y data, which is highly correlated with crude oil prices, could decline as well as shown on the weekly chart (but this will change if / when economy “booms”).
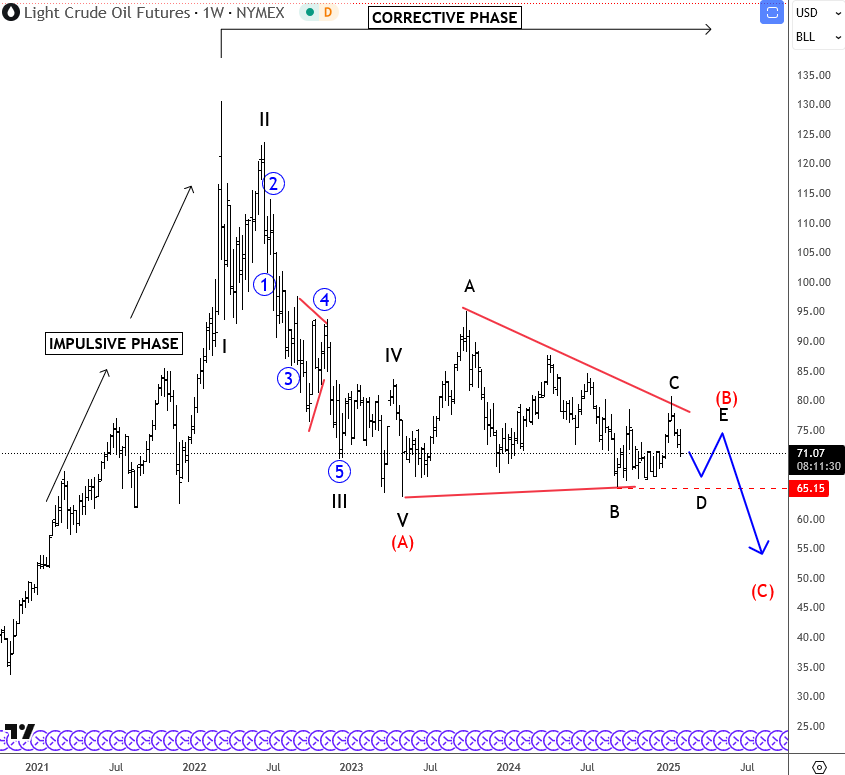
From an Elliott wave perspective, we are tracking an ongoing A-B-C-D-E triangle pattern, but wave E could still push prices a bit higher, for a rally in the next few weeks, because the pattern appears incomplete. But, once this triangle concludes, I expect a break to the downside. This would likely coincide with lower inflation expectations as mentioned; thus lower US yields, and a weaker US dollar.
Overall, my assumption is that crude oil will eventually break below $64 per barrel in 2025!
More By This Author:
Stocks And Cryptos Have Space For More Gains
Aurora Cannabis Turns Bullish After Earnings
USDMXN Is Finishing Wedge Pattern; Delayed Tariffs Could Strengthen Mexican Peso


Comments
Log in or sign up to join the conversation.