
Elliott Wave Technical Analysis: Australian Dollar/U.S. Dollar - Monday, March 24
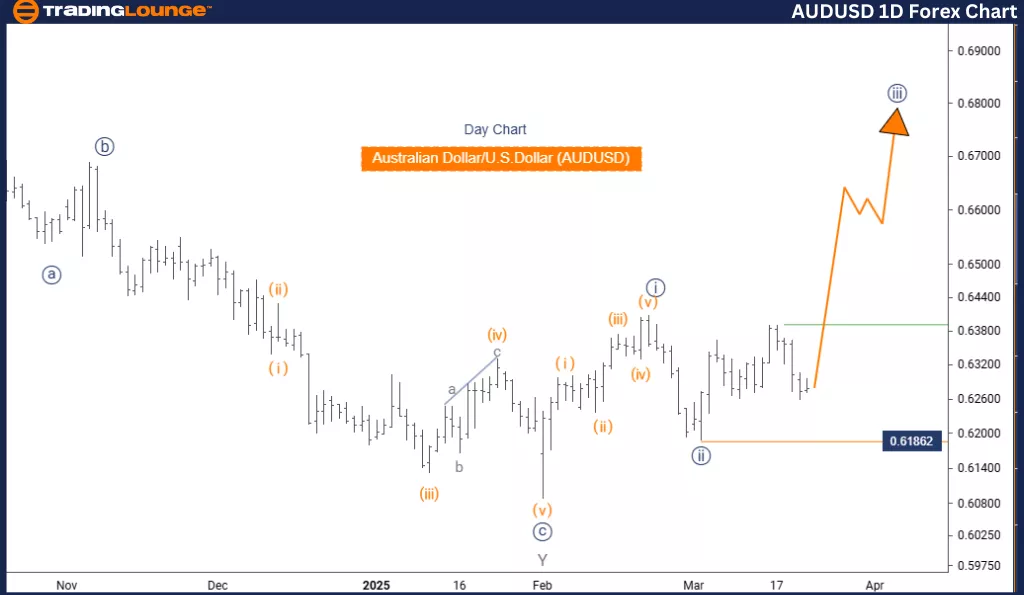
Australian Dollar/U.S. Dollar (AUDUSD) Day Chart
AUDUSD Elliott Wave Technical Analysis
FUNCTION: Trend
MODE: Impulsive
STRUCTURE: Navy Blue Wave 3
POSITION: Gray Wave 1
DIRECTION NEXT HIGHER DEGREES: Navy Blue Wave 3 (Started)
DETAILS: Navy Blue Wave 2 appears completed; Navy Blue Wave 3 is now active.
Cancel Invalid Level: 0.61862
The daily Elliott Wave analysis of the AUDUSD currency pair offers a clear overview of its current market position and potential direction. The pair is showing signs of trending behavior, with a strong impulsive movement rather than corrective action.
The chart focuses on Navy Blue Wave 3, nested within Gray Wave 1, showing its place in the larger Elliott Wave cycle. Analysis suggests Navy Blue Wave 2 has likely ended, marking the start of Navy Blue Wave 3.
This active wave phase is expected to continue with strong price moves before another major trend emerges. The higher-degree wave to track is also Navy Blue Wave 3, which has already begun. A key invalidation level is set at 0.61862. A price break beyond this would nullify the current wave structure and may indicate a shift in trend.
Traders should monitor Navy Blue Wave 3 closely, as further upward momentum is possible. This analysis underlines the importance of recognizing wave patterns to better understand upcoming market shifts.
This breakdown of the AUDUSD daily chart helps traders gain insight into the broader market context. It supports planning by focusing on long-term trends and potential market turning points. Wave structures and critical levels are essential for making informed decisions, especially when one wave phase ends and another begins. This structured approach enhances readiness and strategic alignment in changing market environments.
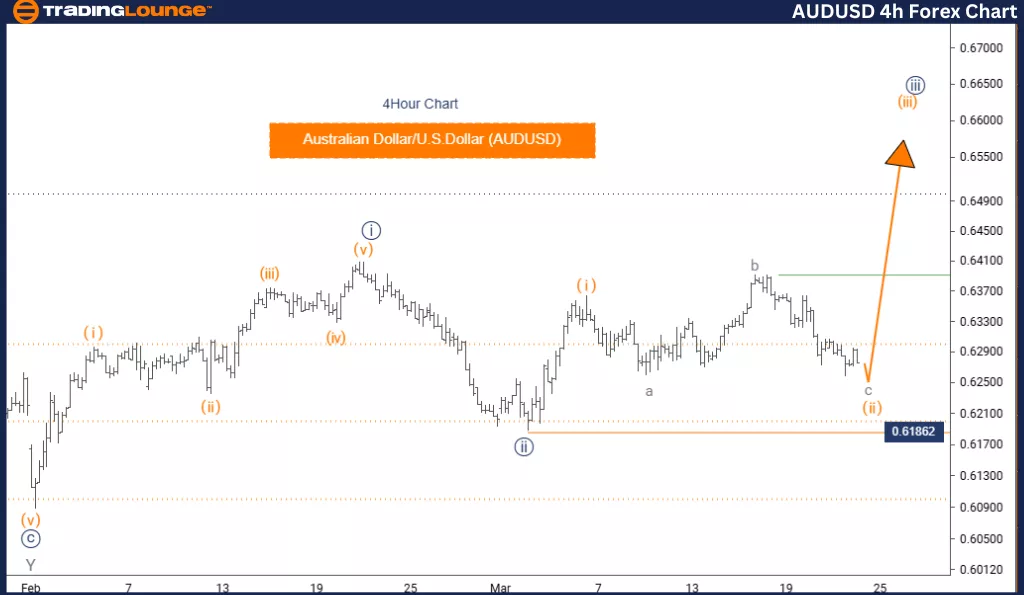
Australian Dollar/U.S. Dollar (AUDUSD) 4 Hour Chart
AUDUSD Elliott Wave Technical Analysis
FUNCTION: Counter Trend
MODE: Corrective
STRUCTURE: Orange Wave 2
POSITION: Navy Blue Wave 3
DIRECTION NEXT HIGHER DEGREES: Orange Wave 3
DETAILS: Orange Wave 1 appears complete; Orange Wave 2 is now active.
Cancel Invalid Level: 0.61862
The Elliott Wave analysis for the AUDUSD 4-hour chart reviews the current trend and short-term movement of the pair. The market is currently in a counter-trend phase, featuring corrective behavior rather than strong directional motion.
The focus is on Orange Wave 2, which is developing within Navy Blue Wave 3. This placement confirms the wave’s role in a larger pattern. Based on the analysis, Orange Wave 1 has likely finished, and the market is transitioning into Orange Wave 2.
This wave is considered corrective and is likely to involve sideways or pullback movements before the start of the next trend. Orange Wave 3, the next higher-degree wave, is expected to begin once Orange Wave 2 ends. The invalidation point for the current wave count is at 0.61862. If the price exceeds this level, it could invalidate the present structure and imply a shift in trend.
Traders should watch Orange Wave 2 for signs of completion and prepare for the emergence of Orange Wave 3. Understanding the current wave structure is key to anticipating future price behavior.
This 4-hour chart analysis offers a focused view of the market's short-term movements, giving traders insights for near-term strategies. Identifying wave patterns and key levels helps traders make accurate decisions, especially in pinpointing when one phase ends and the next begins. This approach ensures traders can adapt effectively to market developments.
Technical Analyst: Malik Awais
More By This Author:
Elliott Wave Strategies For SP500, Nasdaq, And Tech Stocks Like Apple And Tesla.
Elliott Wave Technical Forecast: News Corporation
Elliott Wave Analysis - Spotify Technology S.A.
At TradingLounge™, we provide actionable Elliott Wave analysis across over 200 markets. Access live chat rooms, advanced AI & algorithmic charting tools, and curated trade ...
more

