
Spotify Technology S.A. (SPOT) – Elliott Wave Analysis
Daily Chart
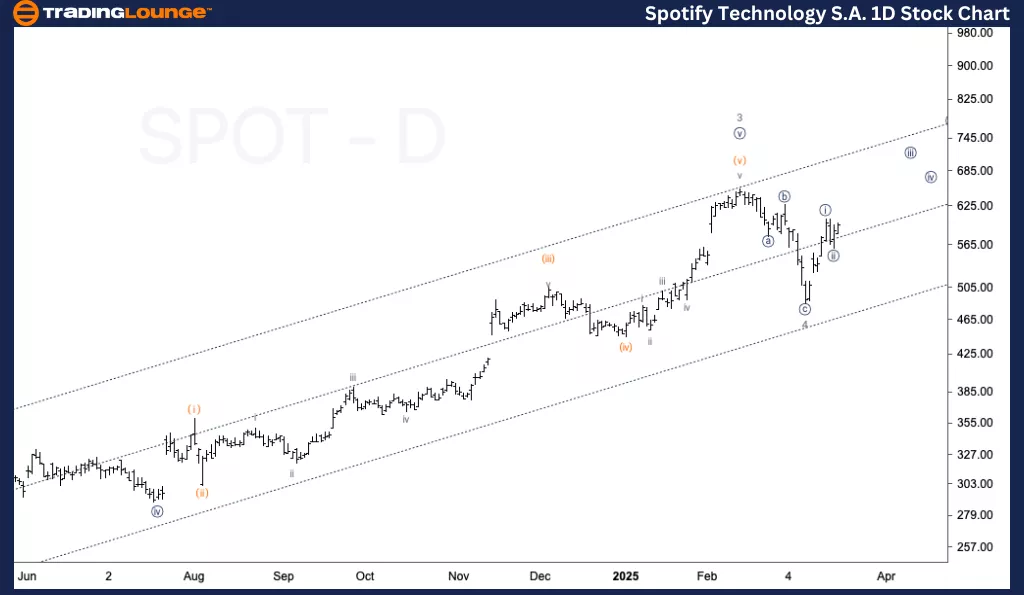
Function: Trend
Mode: Impulsive
Structure: Motive
Position: Wave 5 of (1)
Direction: Upside
Details: Wave 4 found support at TradingLevel5 near $500. Expecting continuation toward $800, contingent on maintaining support above $650.
1-Hour Chart
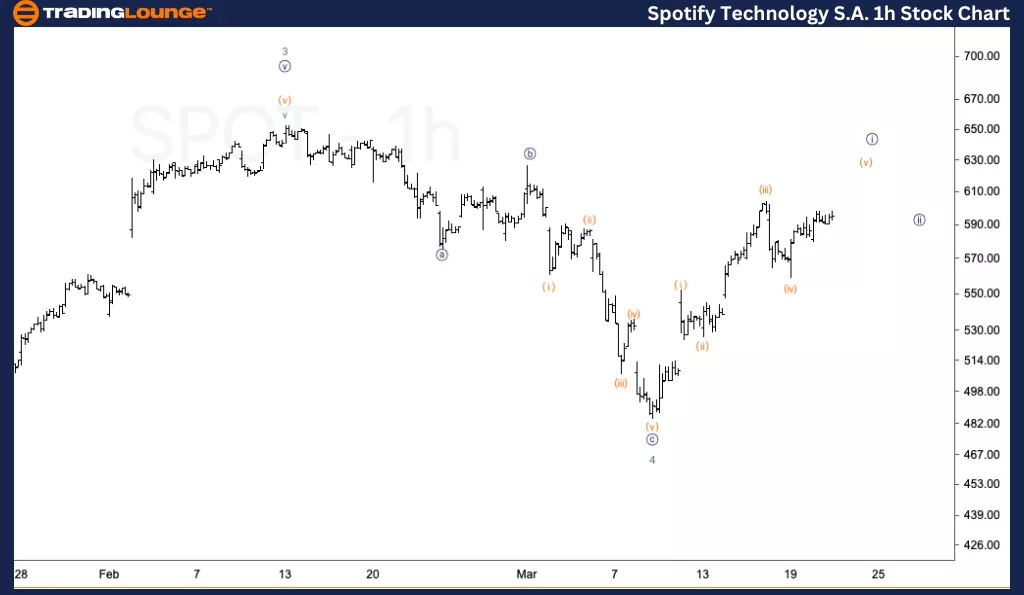
Function: Trend
Mode: Impulsive
Structure: Motive
Position: Wave {i} of 5
Direction: Upside
Details: Alternative count suggests wave {i} is still unfolding. A three-wave move in wave {ii} is expected next, possibly providing short-term upside opportunities.
Spotify Technology S.A. (SPOT) – Elliott Wave Technical Analysis
This analysis covers both the daily and 1-hour charts of SPOT, applying Elliott Wave Theory to identify current trends and anticipate future movements.
Daily Chart Outlook
Spotify seems to have completed wave 4, finding support above the $500 TradingLevel5. If support holds above $650, the stock could continue higher in wave 5, with a potential target near $800.
1-Hour Chart Outlook
The 1-hour chart presents an alternative wave count, indicating wave {i} of 5 is still developing. A corrective wave {ii} is expected next, potentially setting up further upside opportunities in the short term.
Technical Analyst : Alessio Barretta
More By This Author:
Elliott Wave Technical Forecast: News Corporation
Elliott Wave Technical Analysis: British Pound/U.S. Dollar - Friday, March 21
Elliott Wave Technical Analysis: Bovespa Index - Friday, March 21


Comments
Log in or sign up to join the conversation.