
AUDJPY Elliott Wave Analysis – Trading Lounge Day Chart
Australian Dollar / Japanese Yen (AUDJPY) – Day Chart
AUDJPY Elliott Wave Technical Overview
FUNCTION: Counter Trend
MODE: Corrective
STRUCTURE: Navy Blue Wave Y
POSITION: Gray Wave Y
DIRECTION (NEXT LOWER DEGREES): Navy Blue Wave Y (initiated)
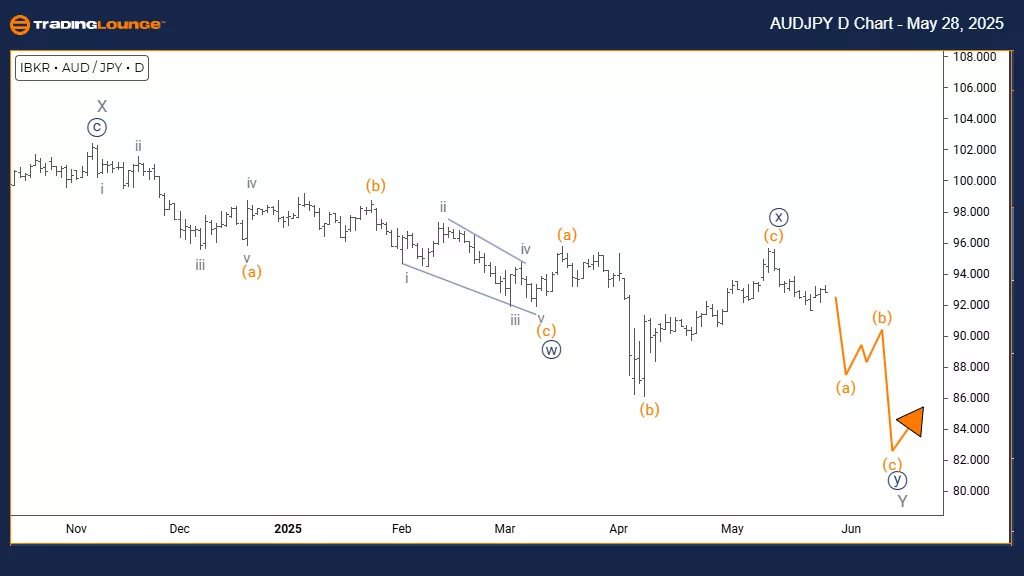
DETAILS: The completion of navy blue wave X indicates the commencement of navy blue wave Y of Y.
The daily chart analysis for AUDJPY highlights a corrective counter-trend phase, part of a broader complex market structure. Currently, navy blue wave Y is unfolding, embedded within a larger corrective pattern known as gray wave Y. This progression follows the conclusion of navy blue wave X and marks the beginning of what seems to be the last phase in this multi-layered correction. Typically, such formations suggest a nearing end to the corrective process, which may precede a return to the prevailing market trend.
The evidence confirms navy blue wave X has finalized, and the market is now experiencing the movements of navy blue wave Y. This wave is characterized by overlapping patterns and restrained momentum—features that differ from more aggressive impulsive trends. These traits allow traders to better understand the asset's current standing within its market cycle, emphasizing the intricate nature of the correction.
The ongoing structure suggests AUDJPY may continue displaying volatility until the final stages of this corrective sequence are complete. Traders are advised to closely observe market behavior for signs indicating the conclusion of wave Y, which could signal the end of the overall correction. The daily chart underlines that this is still a corrective setting, not a new trend direction, thus requiring cautious strategy implementation and proper risk management.
This Elliott Wave analysis provides valuable guidance through the current corrective phase, offering insight into probable reversal points and completion signals. As this movement is likely the final leg of a complex correction, the primary trend may eventually reassert itself once the correction ends.
Australian Dollar / Japanese Yen (AUDJPY) – 4 Hour Chart
AUDJPY Elliott Wave Technical Overview
FUNCTION: Counter Trend
MODE: Impulsive
STRUCTURE: Orange Wave A
POSITION: Navy Blue Wave Y
DIRECTION (NEXT LOWER DEGREES): Orange Wave A (initiated)
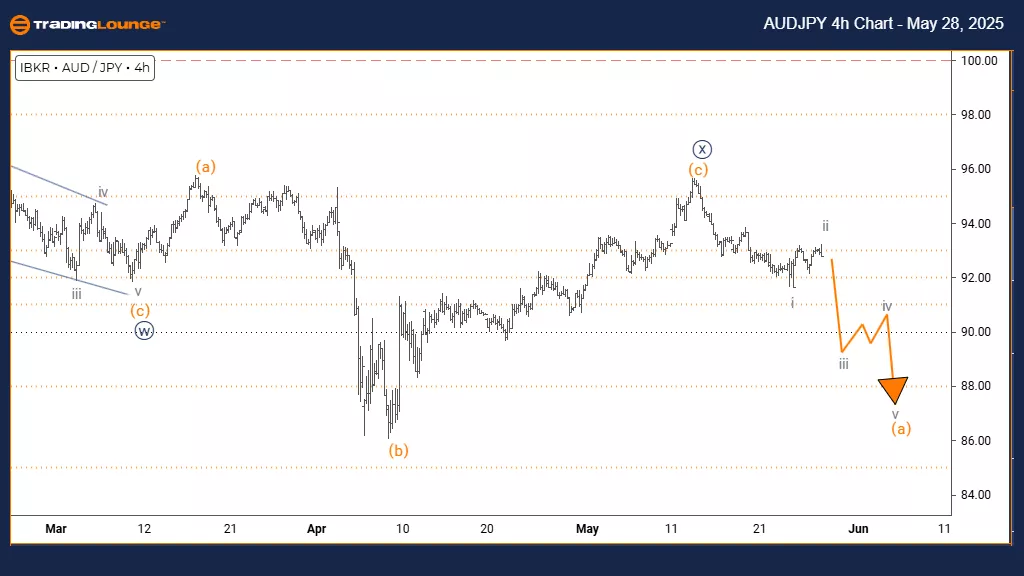
DETAILS: Completion of navy blue wave X suggests orange wave A of Y has commenced.
The 4-hour chart for AUDJPY reveals a counter-trend environment showing impulsive traits within an ongoing corrective pattern. Orange wave A is progressing as a segment of the broader corrective phase known as navy blue wave Y. The end of navy blue wave X signals the beginning of this downward impulsive movement, indicating the market might be entering the initial leg of a deeper, more intricate correction.
The setup confirms navy blue wave X is over and orange wave A has started its descent. This impulsive leg features strong bearish momentum, underscoring seller control in the current scenario. Since this occurs within navy blue wave Y, it indicates a likely continuation of this bearish tone. Traders gain critical perspective from this positioning, understanding it as part of a corrective phase rather than a full trend reversal.
This market setup implies AUDJPY may keep sliding during the active impulse wave. Despite this, traders should remain aware that the broader context is still corrective. Monitoring the chart for signs of wave A's end could help identify the start of wave B—a possible upward retracement. This interpretation offers a practical framework for engaging the market during a complex correction.
Understanding this Elliott Wave structure aids traders in managing expectations for both short-term declines and potential bounces. As this current wave only represents part of a larger correction, more wave formations are anticipated before the overall pattern reaches resolution.
Technical Analyst: Malik Awais
More By This Author:
Unlocking ASX Trading Success: Car Group Limited - Tuesday, May 27
Elliott Wave Technical Analysis: Fortinet Inc. - Tuesday, May 27
Elliott Wave Technical Analysis: U.S. Dollar/Canadian Dollar - Tuesday, May 27


Comments
Log in or sign up to join the conversation.