
FTNT Elliott Wave Analysis – Trading Lounge Daily & 1H Chart
Fortinet Inc. (FTNT) – Elliott Wave Technical Analysis
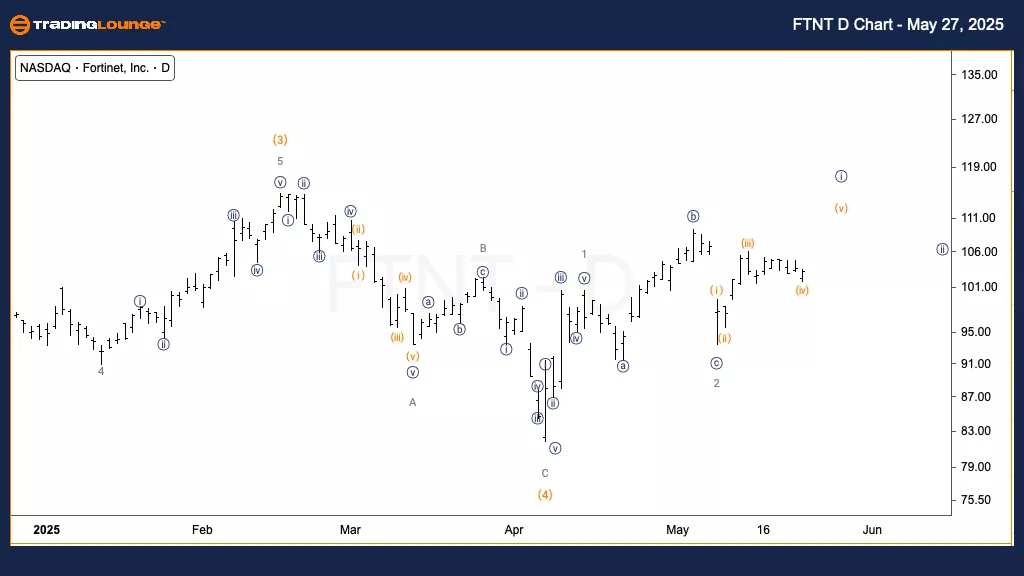
Daily Chart Overview
FUNCTION: Trend
MODE: Motive
STRUCTURE: Impulsive
POSITION: Wave {i} of 3
DIRECTION: Upside in {i}
DETAILS: Several nested 1-2 setups are developing. Continued support above $100 suggests strength in Intermediate wave (5).
Fortinet Inc. (FTNT) shows a bullish structure on the daily chart. The pattern suggests that wave {i} of 3 is unfolding within Intermediate wave (5). Buyers continue to support the price above $100, reinforcing a strong foundation for upward momentum. If this support holds, we could see a significant impulsive move higher.
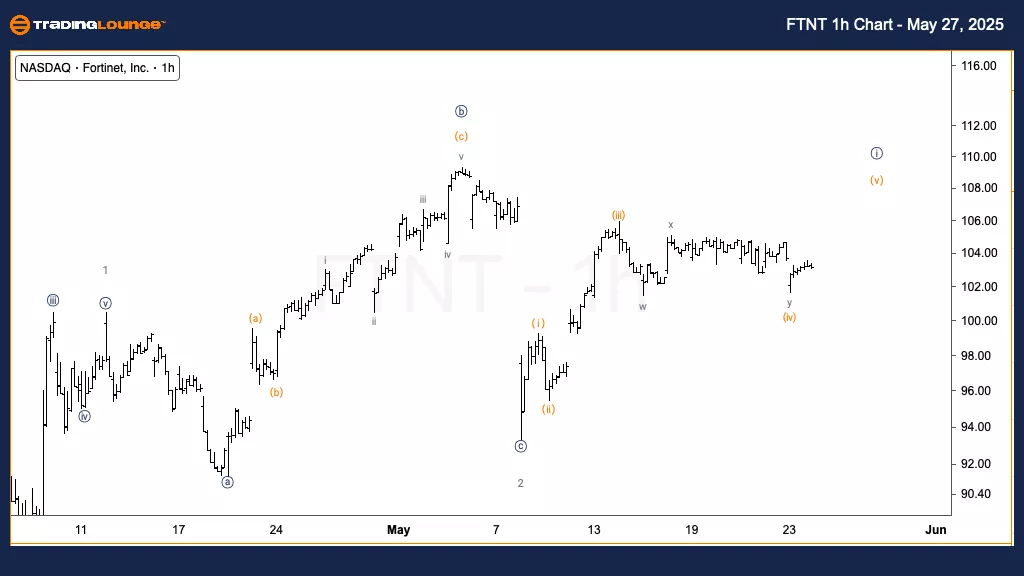
1-Hour Chart Overview
FUNCTION: Trend
MODE: Impulsive
STRUCTURE: Motive
POSITION: Wave (iv) of {i}
DIRECTION: Upside in wave (v)
DETAILS: Expecting wave (v) to extend higher and complete the Minute wave {i}, as the current structure lacks a final fifth wave.
On the 1-hour chart, FTNT is consolidating in wave (iv), preparing for a move into wave (v). This next upward step would complete the five-wave sequence of Minute wave {i}. Short-term traders should watch for resistance levels as wave (v) unfolds.
Technical Analyst: Alessio Barretta
More By This Author:
Elliott Wave Technical Analysis: Ethereum Crypto Price News For Tuesday, May 27
Elliott Wave Technical Forecast Dow Jones
Elliott Wave Technical Analysis: Tesla Inc. - Monday, May 26


Comments
Log in or sign up to join the conversation.