
TSLA Elliott Wave Analysis | Trading Lounge
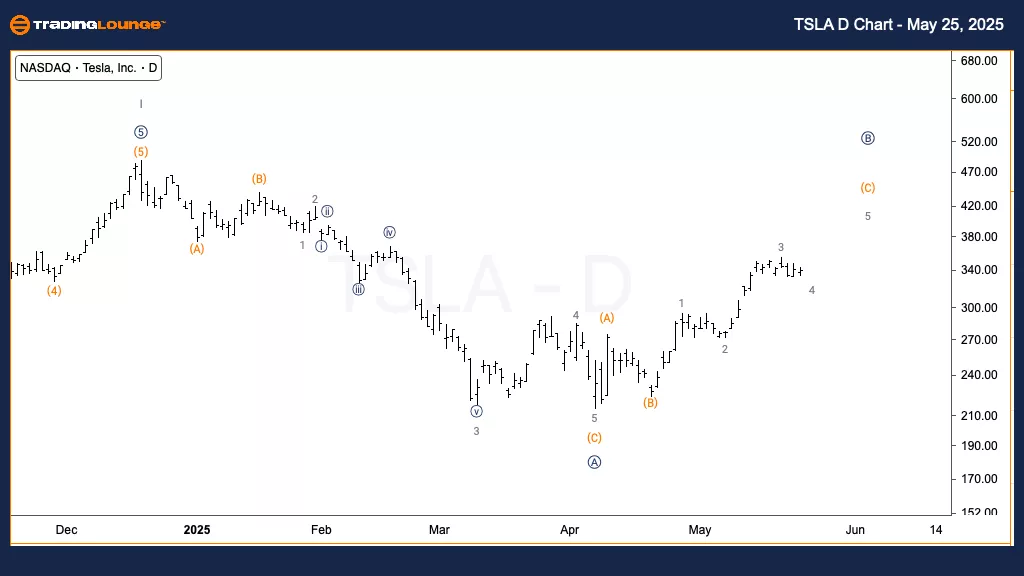
Tesla Inc. (TSLA) – Daily Chart
TSLA Elliott Wave Technical Analysis
FUNCTION: Counter Trend
MODE: Corrective
STRUCTURE: Flat
POSITION: Wave (C) of B
DIRECTION: Upside in Wave (C)
DETAILS: Anticipating one final push higher in Intermediate Wave (C), which appears to need one more leg up to complete the five-wave subdivision.
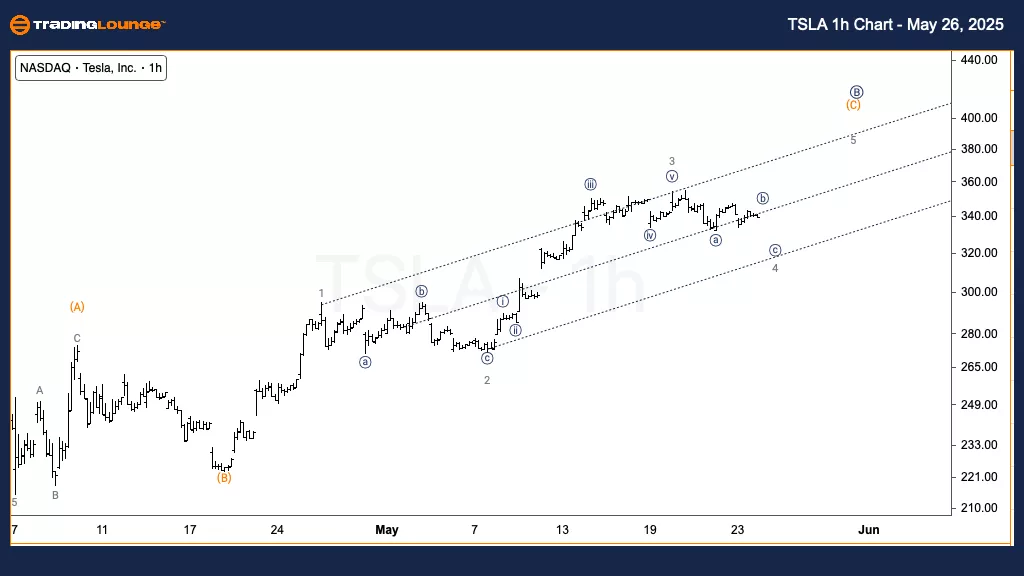
Tesla Inc. (TSLA) – 1H Chart
TSLA Elliott Wave Technical Analysis
FUNCTION: Counter Trend
MODE: Corrective
STRUCTURE: Flat
POSITION: Wave {c} of 4
DIRECTION: Downside in Wave {c}
DETAILS: Expecting another leg down in Wave {c} to finish Minor Wave 4. Price could touch the lower channel boundary before rebounding.
This Elliott Wave analysis for Tesla Inc. (TSLA) evaluates both the daily and 1-hour timeframes to outline likely market behavior using Elliott Wave Theory.
Daily Outlook:
TSLA is progressing through the final stages of a corrective flat pattern. Wave (C) is expected to move higher to complete the current structure. Traders should watch for signs of resistance as this upward leg may mark the end of the broader correction before the next major move.
1-Hour Outlook:
TSLA appears to be declining within Wave {c} of Minor Wave 4. A move toward the base of the price channel is anticipated, where a reversal could lead into a new bullish Wave 5, supporting the daily chart's projected completion of Wave (C).
Technical Analyst: Alessio Barretta
Source: Visit TradingLounge.com and learn from the experts!
More By This Author:
Elliott Wave Technical Analysis: British Pound/U.S. Dollar - Monday, May 26
Theta Token Crypto Price News Today
Unlocking ASX Trading Success: Insurance Australia Group Limited - Friday, May 23


Comments
Log in or sign up to join the conversation.