
DOW JONES – DJI Elliott Wave Analysis | Trading Lounge Day Chart
DOW JONES – DJI Elliott Wave Technical Analysis
FUNCTION: Bullish Trend
MODE: Impulsive
STRUCTURE: Orange Wave 3
POSITION: Navy Blue Wave 1
DIRECTION NEXT LOWER DEGREES: Orange Wave 4
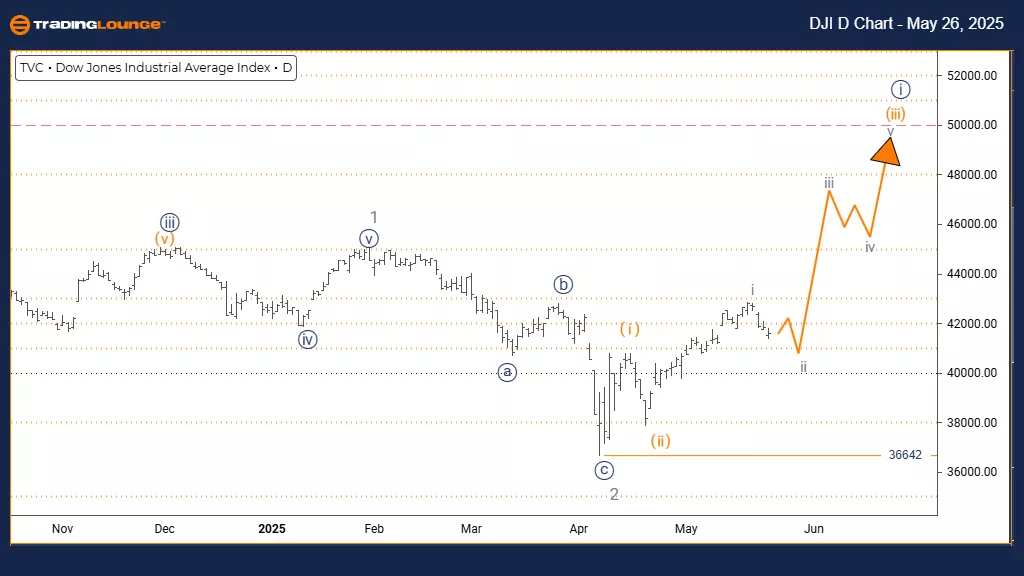
DETAILS: Orange Wave 2 appears complete. Orange Wave 3 is now unfolding.
Invalidation Level: 36642
The daily chart reveals strong bullish momentum in the Dow Jones Industrial Average, progressing within an established uptrend. The current Elliott Wave configuration highlights the development of orange wave three inside a broader bullish structure labeled navy blue wave one. With the completion of orange wave two, the market has entered what is typically the most aggressive phase of an impulsive wave.
The analysis confirms the conclusion of orange wave two, setting the stage for the ongoing advance of wave three. The impulsive characteristics indicate strong institutional buying pressure, supporting the potential for further upside. A break below 36642 would invalidate the current wave count and may suggest a deeper correction or structural reassessment.
This wave structure provides traders with a bullish outlook, placing the index in a highly favorable phase for trend-followers. The next anticipated move in the lower degree will be orange wave four—a corrective retracement expected after the current bullish impulse. Traders should monitor for continuation signals while adjusting risk as the current rally matures.
DOW JONES – DJI Elliott Wave Analysis | Trading Lounge Weekly Chart
DOW JONES – DJI Elliott Wave Technical Analysis
FUNCTION: Bullish Trend
MODE: Impulsive
STRUCTURE: Navy Blue Wave 1
POSITION: Gray Wave 3
DIRECTION NEXT LOWER DEGREES: Navy Blue Wave 2
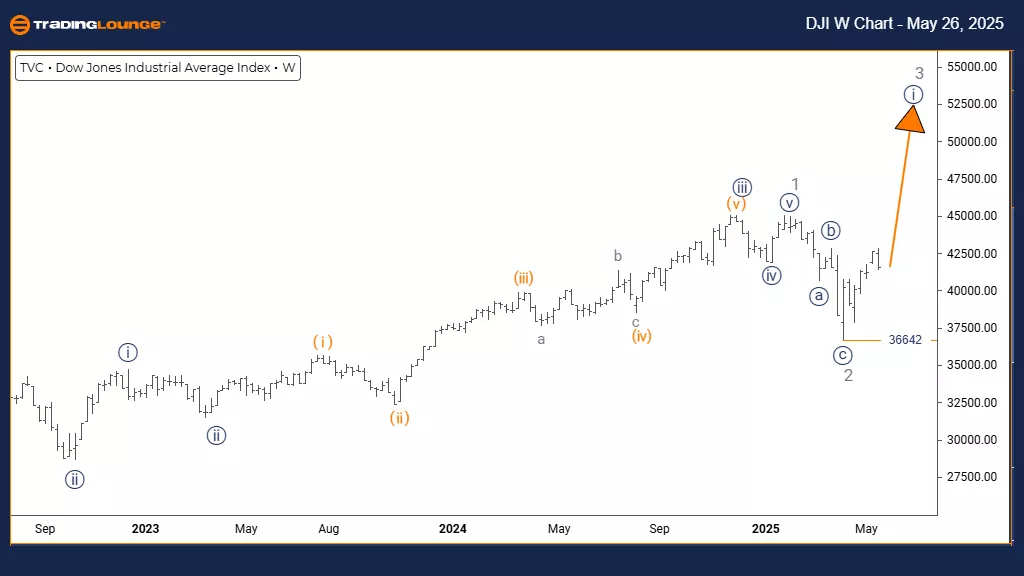
DETAILS: Gray Wave 2 appears complete. Navy Blue Wave 1 of 3 is now underway.
Invalidation Level: 36642
The weekly chart offers a strong bullish outlook for the Dow Jones Industrial Average, reflecting an impulsive structure with navy blue wave one forming within a larger gray wave three. With gray wave two now completed, the index is entering a new upward phase, suggesting a long-term rally may be in its early stages.
The wave count validates the start of navy blue wave one, with solid buying momentum pushing prices higher. The longer-term weekly view suggests that this bullish phase could extend for weeks or months. A key invalidation point at 36642 serves as the line in the sand; a break below this could indicate a need to reassess the wave count.
This Elliott Wave setup frames the Dow Jones within the early stages of a potentially extended advance. The expected follow-up move is navy blue wave two—a corrective wave to follow the initial upward impulse. Investors should watch for wave confirmations and protect positions near the critical invalidation level while preparing for longer-term bullish developments.
Technical Analyst: Malik Awais
Visit TradingLounge.com and learn from the experts!
More By This Author:
Elliott Wave Technical Analysis: British Pound/U.S. Dollar - Monday, May 26
Theta Token Crypto Price News Today
Unlocking ASX Trading Success: Insurance Australia Group Limited - Friday, May 23


Comments
Log in or sign up to join the conversation.