
USDCAD Elliott Wave Analysis – Trading Lounge
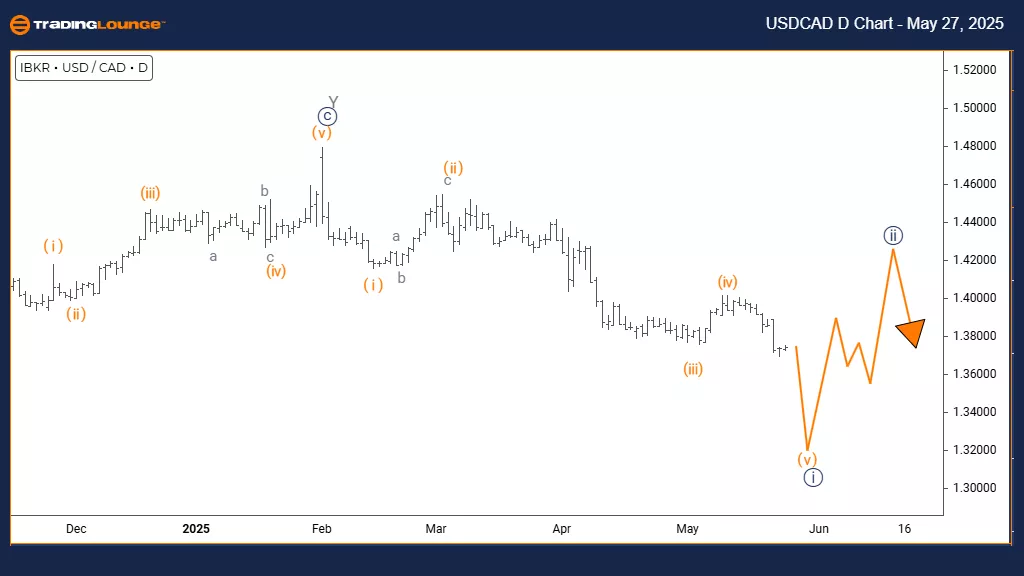
U.S. Dollar / Canadian Dollar (USDCAD) Day Chart
USDCAD Elliott Wave Technical Analysis
FUNCTION: Bearish Trend
MODE: Impulsive
STRUCTURE: Navy Blue Wave 1
POSITION: Gray Wave 1
DIRECTION NEXT LOWER DEGREES: Navy Blue Wave 2
DETAILS: Navy blue wave 1, part of gray wave 1, is shaping a new trend.
Market Overview
The USDCAD daily chart shows a strong bearish setup. The structure indicates the early phase of a downward movement. Navy blue wave 1 is forming within gray wave 1, supporting a broader bearish trend. The current move is only the start of a possible extended decline. There are no signs yet that the market is reversing or weakening.
Wave Structure Details
Navy blue wave 1 within gray wave 1 is active now. This wave marks the beginning of a bigger bearish move. The impulsive nature shows strong selling. The daily chart hints this downtrend might stretch further before any correction appears. It’s not just a short pullback—it could be the start of a prolonged bearish phase.
Trading Context
This setup helps traders understand the currency pair’s position. The structure shows that this might be the start of a broader bearish cycle. The current wave one may lead to navy blue wave two—a corrective move likely to follow after the first wave ends.
Trader Guidance
Watch price movements for signs of the impulse wave’s continuation. Also, look out for high trading volume and increasing momentum—typical of new trends. This analysis suggests more downside for USDCAD, although all impulses eventually pull back. Traders should be ready for that. The daily chart underscores the strength and possible duration of this trend.
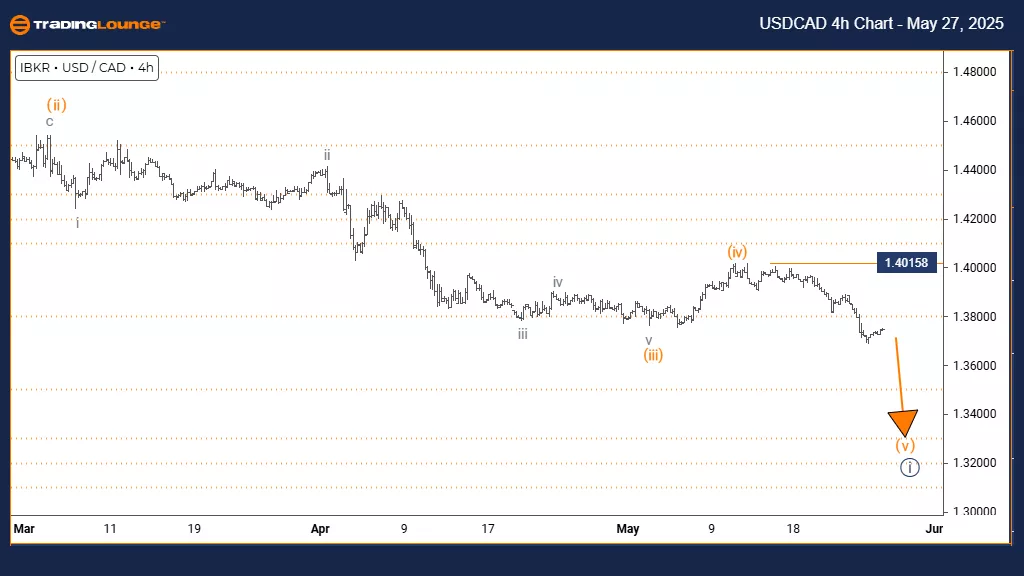
U.S. Dollar / Canadian Dollar (USDCAD) 4 Hour Chart
USDCAD Elliott Wave Technical Analysis
FUNCTION: Bearish Trend
MODE: Impulsive
STRUCTURE: Orange Wave 5
POSITION: Navy Blue Wave 1
DIRECTION NEXT LOWER DEGREES: Orange Wave 5 (started)
DETAILS: Orange wave 4 appears complete. Orange wave 5 is now developing.
Wave Cancel Invalid Level: 1.40158
Market Overview
The 4-hour chart of USDCAD confirms a strong bearish pattern. The current setup shows orange wave 5 forming within navy blue wave 1, following the likely completion of orange wave 4. This move represents the last phase of the downtrend, often signaling a potential end to the impulse. It's common to see either a sharper drop or signals of trend weakening here.
Wave Development
Analysis confirms orange wave 4 has ended. Orange wave 5 is active, pushing the price further down. The structure inside navy blue wave 1 supports this extended bearish move. Persistent selling pressure suggests more downside is likely before the pattern ends. Traders should prepare for either a steeper decline or early signs of a reversal.
Trading Strategy Insights
This wave structure helps traders identify shorting opportunities. Orange wave 5 could mark the final drop within this cycle. Monitoring price behavior is essential—look for typical signs of a fifth wave, such as divergence in momentum or slowing declines. These can signal the end of the trend.
Risk Management and Watch Points
This setup guides traders on spotting trend continuation or reversal. While the bearish forecast remains valid, it's crucial to stay alert for signs of completion. These signals may mark the end of this wave and the start of a new trend. The Elliott Wave view provides practical guidance for risk management during this likely final leg of the current bearish cycle.
Technical Analyst: Malik Awais
More By This Author:
Elliott Wave Technical Analysis: Ethereum Crypto Price News For Tuesday, May 27
Elliott Wave Technical Forecast Dow Jones
Elliott Wave Technical Analysis: Tesla Inc. - Monday, May 26


Comments
Log in or sign up to join the conversation.