
AUDJPY Elliott Wave Analysis | Trading Lounge
Australian Dollar / Japanese Yen (AUDJPY) Day Chart
AUDJPY Elliott Wave Technical Analysis
FUNCTION: Counter Trend
MODE: Impulsive
STRUCTURE: Navy Blue Wave X
POSITION: Gray Wave X
DIRECTION NEXT LOWER DEGREES: Navy Blue Wave Y
DETAILS: Navy Blue Wave W seems completed; now Navy Blue Wave X is in progress.
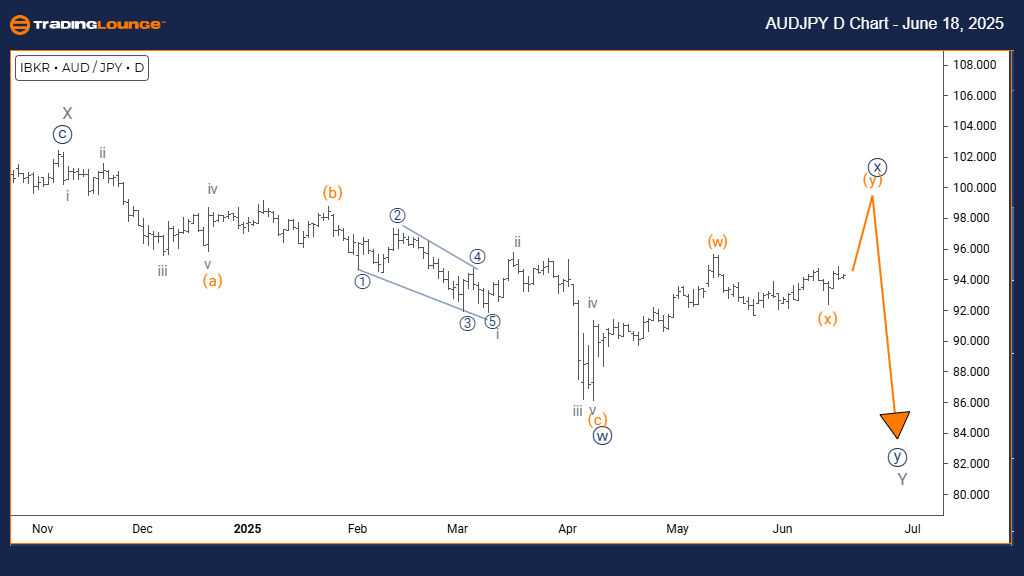
The AUDJPY daily chart Elliott Wave analysis shows a counter-trend pattern. The price is moving impulsively, indicating strong movement against the main trend. The current wave structure is Navy Blue Wave X, which fits into a broader corrective pattern under Gray Wave X. This implies that the pair is undergoing a correction phase that may become more complex.
Navy Blue Wave W looks to have finished, and the market has entered Navy Blue Wave X. This wave is still part of a larger correction and may develop into a combination pattern. The next movement expected is Navy Blue Wave Y after Navy Blue Wave X concludes.
The current technical view suggests AUDJPY may continue in a counter-trend direction. With Navy Blue Wave X active, strong momentum is visible. However, traders should be cautious—this is not a new trend but part of an ongoing correction.
Australian Dollar / Japanese Yen (AUDJPY) 4-Hour Chart
AUDJPY Elliott Wave Technical Analysis
FUNCTION: Counter Trend
MODE: Impulsive
STRUCTURE: Orange Wave Y
POSITION: Navy Blue Wave X
DIRECTION NEXT HIGHER DEGREES: Orange Wave Y (Initiated)
DETAILS: Orange Wave X looks completed; now Orange Wave Y of Navy Blue Wave X is active.
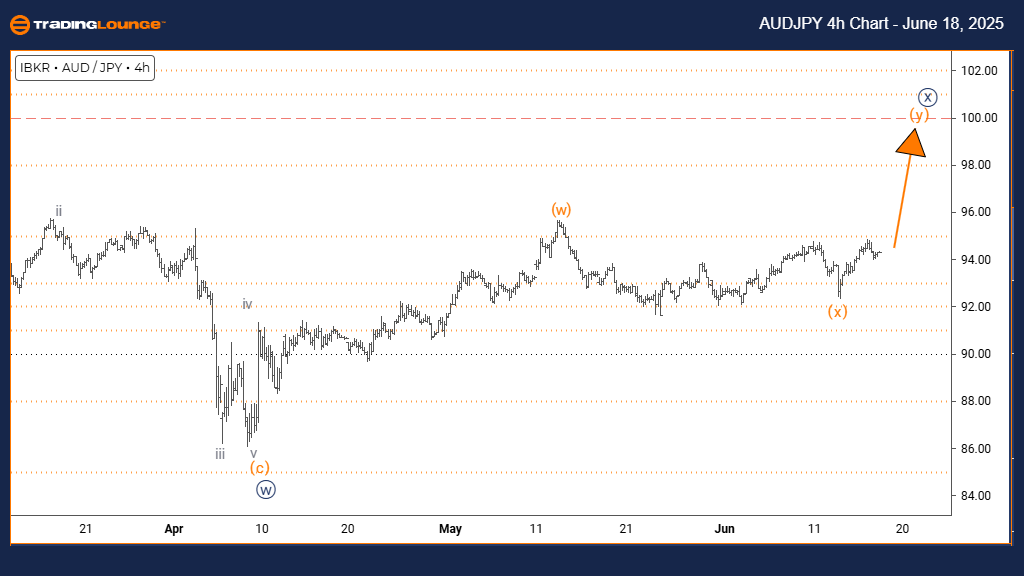
The AUDJPY 4-hour chart analysis shows a counter-trend setup with impulsive price movement against the main direction. The current wave structure is Orange Wave Y, part of the larger corrective Navy Blue Wave X. This suggests continued correction with a potential for a complex wave form.
Orange Wave X appears to have ended, leading to the formation of Orange Wave Y within Navy Blue Wave X. This is expected to be a zigzag or similar corrective pattern. Orange Wave Y is the key structure to track next.
The technical picture suggests that AUDJPY may continue its counter-trend activity. As Orange Wave Y progresses, strong momentum is evident. Traders should recognize this is part of a larger correction and not a signal of a long-term trend reversal.
Technical Analyst: Malik Awais
More By This Author:
Elliott Wave Technical Analysis: Swiss Market Index - Wednesday, June 18
Elliott Wave Technical Analysis: AAVE/USD Crypto Price News For Wednesday, June 18
Unlocking ASX Trading Success: Mineral Resources


Comments
Log in or sign up to join the conversation.