

Image Source: Pexels
Elliott Wave Analysis – AAVE/USD – Daily and H4 Charts by TradingLounge
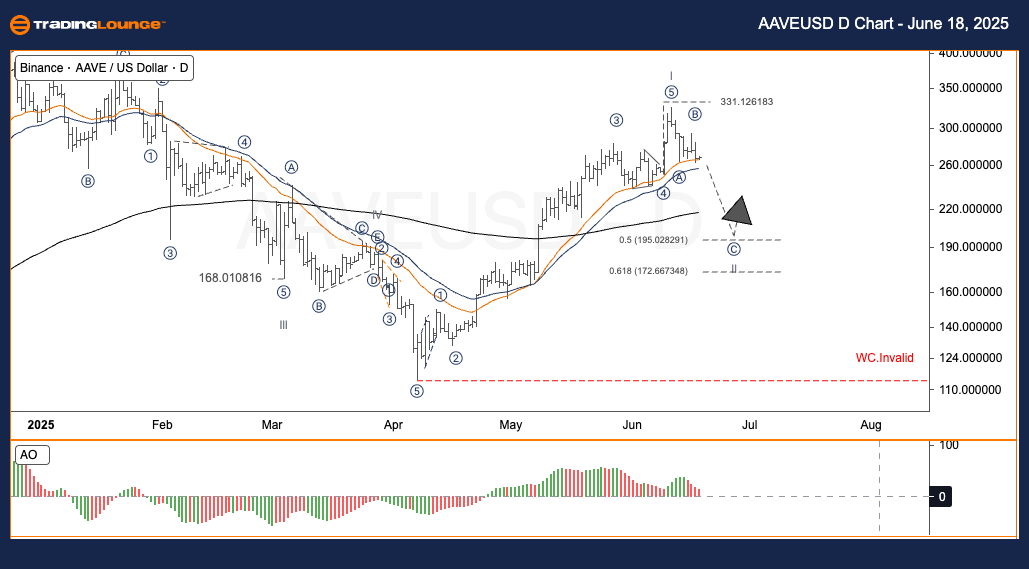
AAVE/USD Elliott Wave Technical Analysis (Daily Chart)
- Function: Counter Trend
- Mode: Corrective
- Structure: Not Applicable
- Position: Wave 2
- Invalidation Level: $116
Analysis Summary:
Following the end of its Wave V downtrend near the $50–$60 zone in April, AAVE/USD began a strong recovery, forming a complete impulsive move up to Wave I, which peaked at $331.12. Currently, the price action is showing weakness, which aligns with the onset of Wave II, typically seen as a pause and correction phase before a longer-term Wave III uptrend emerges.
AAVE/USD Trading Strategy (Daily Chart)
- Short-Term Swing Trade Strategy:
✅ Look for a reversal pattern in the $195–$172 range as a potential entry zone for positioning with Wave III. - Risk Management:
🟥 The bullish outlook holds as long as the price stays above the invalidation level at $116.
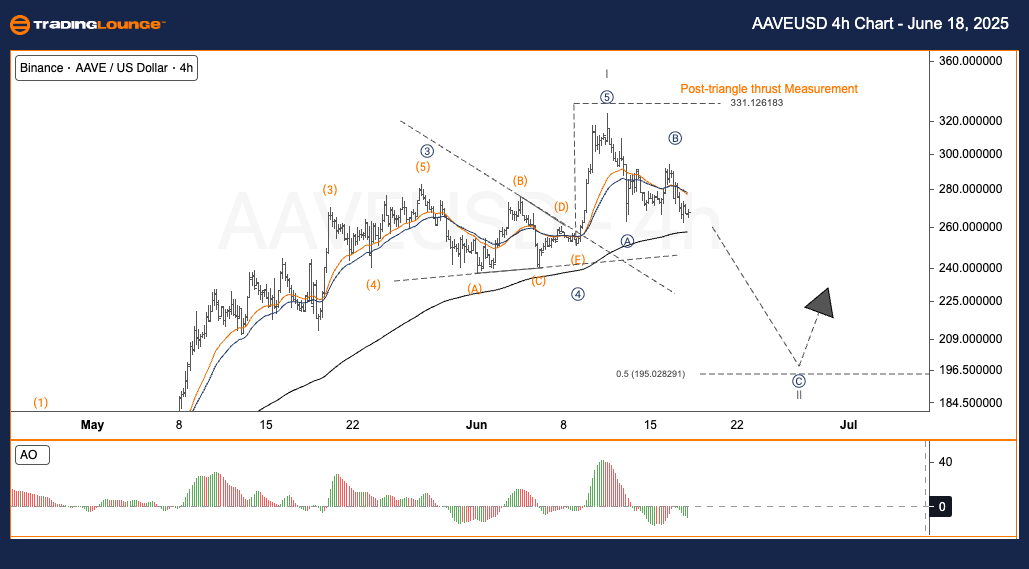
AAVE/USD Elliott Wave Technical Analysis (H4 Chart)
- Function: Counter Trend
- Mode: Corrective
- Structure: Not Applicable
- Position: Wave 2
- Invalidation Level: $116
Analysis Summary:
AAVE completed its V-wave decline around the $50–$60 zone, then initiated a clear uptrend to complete Wave I at $331.12. The current downward movement could be the start of Wave II, commonly a pullback before the beginning of a stronger Wave III bullish phase.
AAVE/USD Trading Strategy (H4 Chart)
- Swing Trade Entry Plan:
✅ Watch for reversal confirmation signals between $195–$172 for a potential long position targeting the next major move. - Risk Management:
🟥 The current wave count remains valid unless $116 support is breached.
Analyst: Kittiampon Somboonsod, CEWA
Source: TradingLounge.com
More By This Author:
Unlocking ASX Trading Success: Mineral Resources
Elliott Wave Technical Analysis: British Pound/U.S. Dollar - Tuesday, June 17
Elliott Wave Technical Analysis: Shanghai Composite Index - Tuesday, June 17


Comments
Log in or sign up to join the conversation.