
SWISS MARKET INDEX Elliott Wave Analysis | Trading Lounge Day Chart
SWISS MARKET INDEX Wave Technical Analysis
FUNCTION: Counter Trend
MODE: Corrective
STRUCTURE: Orange Wave 2
POSITION: Navy Blue Wave 1
DIRECTION NEXT HIGHER DEGREES: Orange Wave 3
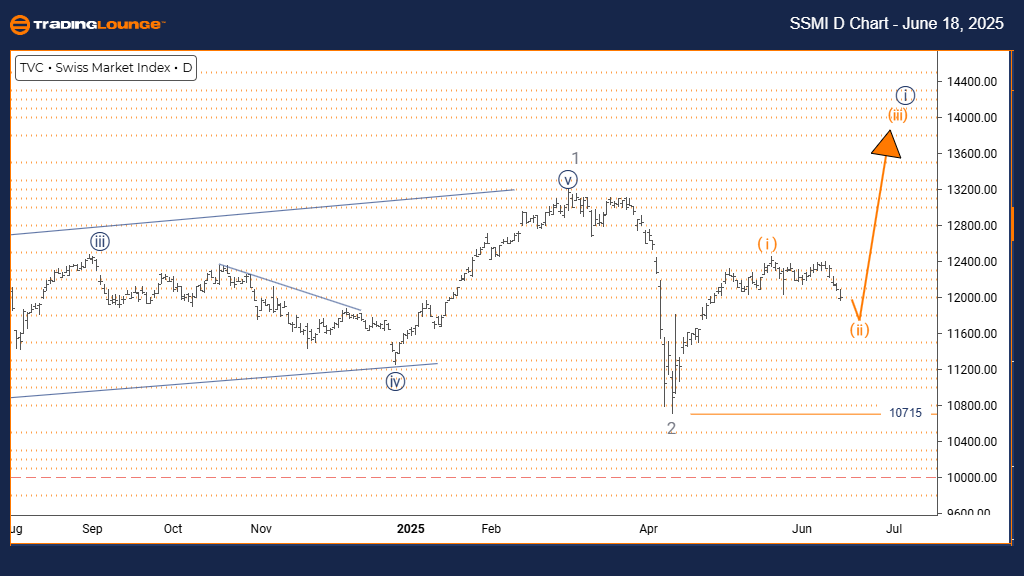
DETAILS: Orange Wave 1 appears completed; Orange Wave 2 is now active.
Wave Cancel Invalid Level: 10715
The SWISS MARKET INDEX daily chart shows a counter-trend correction currently underway. The price action is corrective, indicating a pullback within the broader upward structure. Orange Wave 2 is developing as part of the ongoing formation under Navy Blue Wave 1, pointing to a short-term retracement in the index.
Orange Wave 1 seems to have finished, transitioning the market into Orange Wave 2. This wave typically retraces some of the gains from Wave 1 and precedes the emergence of Orange Wave 3, which is expected to resume the dominant trend.
Currently, the index is moving through Orange Wave 2. This corrective phase may lead to range-bound activity or mild declines. The key support level to monitor is 10715. If this level breaks, the current wave count will be invalid. Until then, the structure supports the idea of a temporary correction before upward movement resumes.
SWISS MARKET INDEX Elliott Wave Analysis | Trading Lounge Weekly Chart
SWISS MARKET INDEX Wave Technical Analysis
FUNCTION: Bullish Trend
MODE: Impulsive
STRUCTURE: Navy Blue Wave 1
POSITION: Gray Wave 3
DIRECTION NEXT LOWER DEGREES: Navy Blue Wave 2
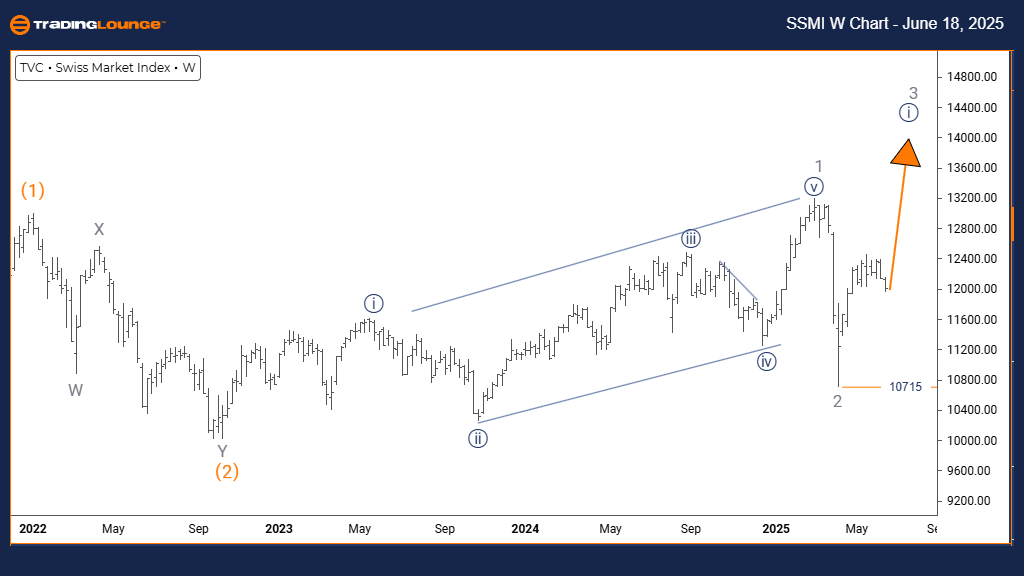
DETAILS: Gray Wave 2 seems completed; Navy Blue Wave 1 of 3 is now developing.
Wave Cancel Invalid Level: 10715
The SWISS MARKET INDEX weekly chart analysis reflects a bullish trend. After completing Gray Wave 2, the index has moved into Navy Blue Wave 1 of Gray Wave 3. This marks the start of a potentially strong impulsive movement.
Orange Wave 2 is currently forming within the broader Navy Blue Wave 1. This wave is corrective in nature and may involve sideways or limited downside price action. The support level at 10715 remains critical; a break below this would challenge the current bullish interpretation.
Following the completion of Orange Wave 2, the index is expected to start Orange Wave 3. This wave usually represents the strongest move in an Elliott Wave cycle. Traders should observe for signs of Wave 2 completion to potentially benefit from the upward move in Wave 3.
The market is currently in a corrective pause within a longer bullish trend. The 10715 level is important to maintain the bullish count. Monitoring the price action near this level is key for the next move.
Technical Analyst: Malik Awais
More By This Author:
Elliott Wave Technical Analysis: AAVE/USD Crypto Price News For Wednesday, June 18
Unlocking ASX Trading Success: Mineral Resources
Elliott Wave Technical Analysis: British Pound/U.S. Dollar - Tuesday, June 17


Comments
Log in or sign up to join the conversation.