Dollar Index And Euro-Dollar Medium-Term Forecast
In mid-January, the main development options for this year for EUR/USD and USD/JPY were considered . At least a short-term strengthening of the dollar was expected; there were still options in the medium term.
Let's look at what happened in 3.5 months and further prospects.
In update 10.01 the following schedule was given
(Click on image to enlarge)
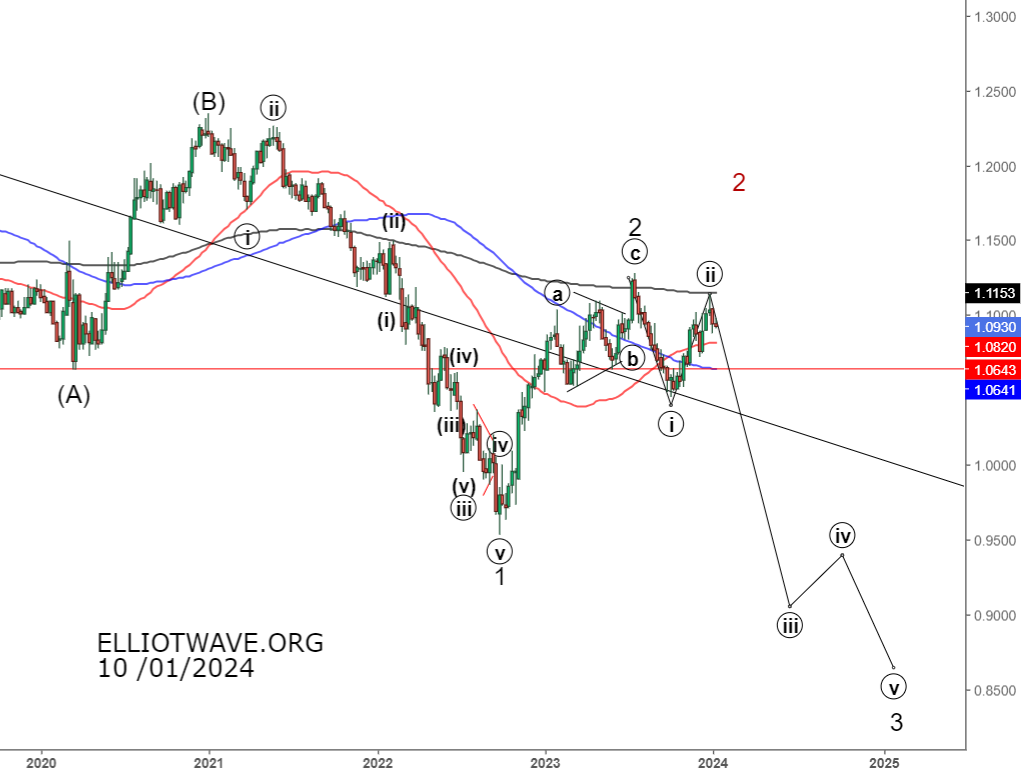
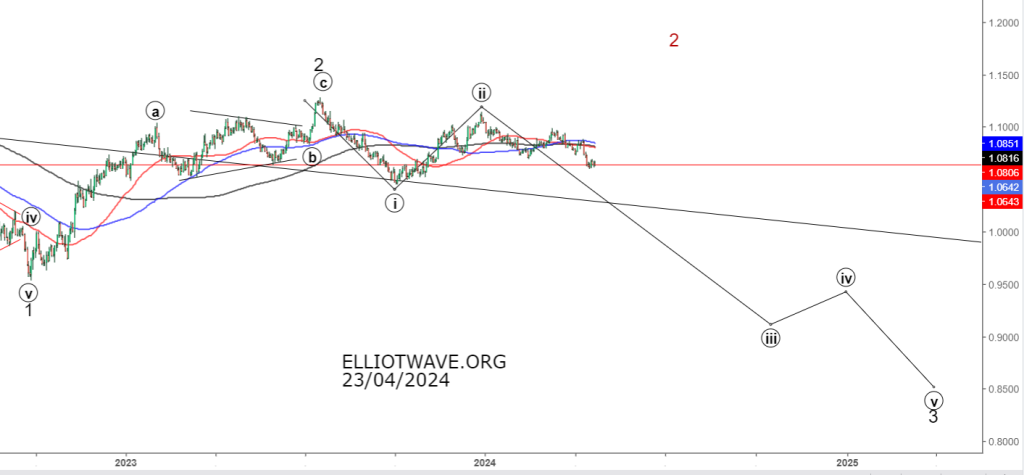
Below is the same graph at the moment. The downward movement from the top ((ii)) (1.1141) continued, we are testing the important level 1.0643. If we break through and consolidate below, the next important mark is a trend mark (in black).
So far, only a zigzag has gone down from 1.1141 , so several scenarios can be distinguished.
- Wave ((ii)) has not yet ended. We may see another division down (or growth will begin from the current ones), after which we will go back to testing 1.1141. This is the main option for now.
- Red. Let's go above 1.1277, because there are doubts about the impulse in wave ((i)). In the last update, this option was also considered, now it is an alternative due to changes in the cyclic pattern (will be discussed below).
- The dollar will strengthen without any significant corrections. There is no evidence of this yet, plus a correction (fall in yield) in American bonds is expected.
(Click on image to enlarge)
Below is a long-term chart of the dollar index. Two channels are shown: red - drawn along ((A)) - ((B)) and black - along (1) - (2). The channel in black is the main one, but the importance of the upper border of the channel should be noted in red. As you can see, it often became a serious level of support and resistance. It was tested by decreasing at the end of 2023, after which growth began. If, nevertheless, it is broken, then the next important mark is the lower border of the channel in black.
(Click on image to enlarge)

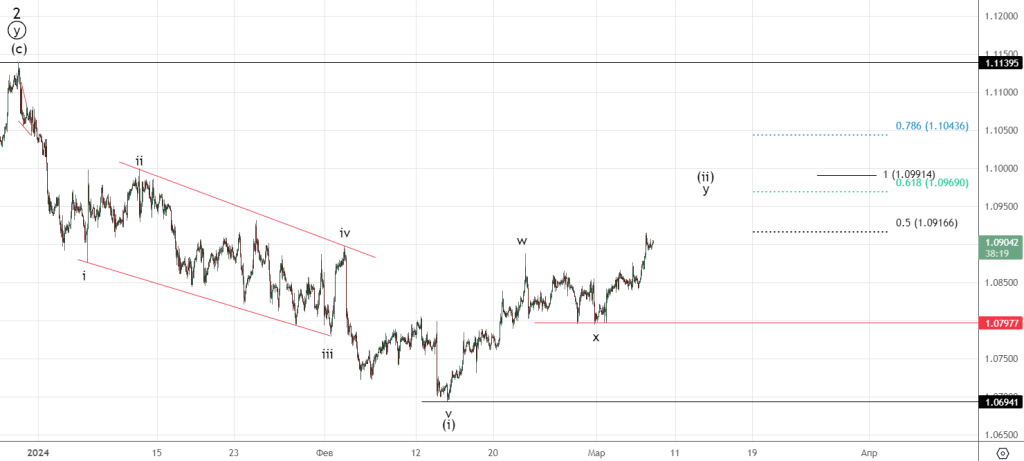
The development of the situation was discussed in detail in a closed section . 03/07 there was this update :
We set a target of 1.09166, but most likely we will go to the range of 1.097 - 1.099, where two targets converge at once.
The general recommendation is to just watch for now, when we reach 1.097 - 1.099, you can try shorts with a stop of 1.11395. If impulses go down approximately from the current ones, then we will look at the situation.
(Click on image to enlarge)
USD/JPY
Last time correction 2 was considered (movement 1-2 in (3)), after its completion growth was expected
(Click on image to enlarge)
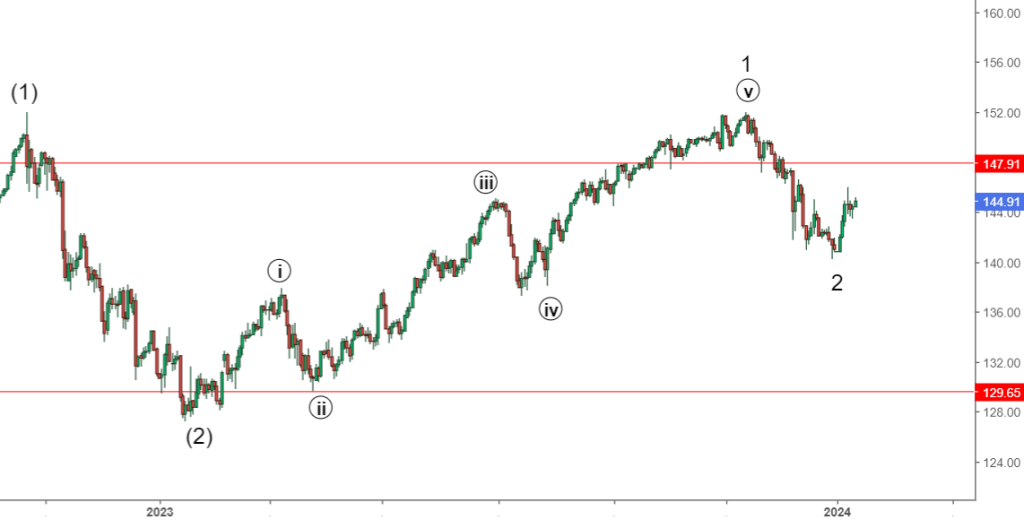
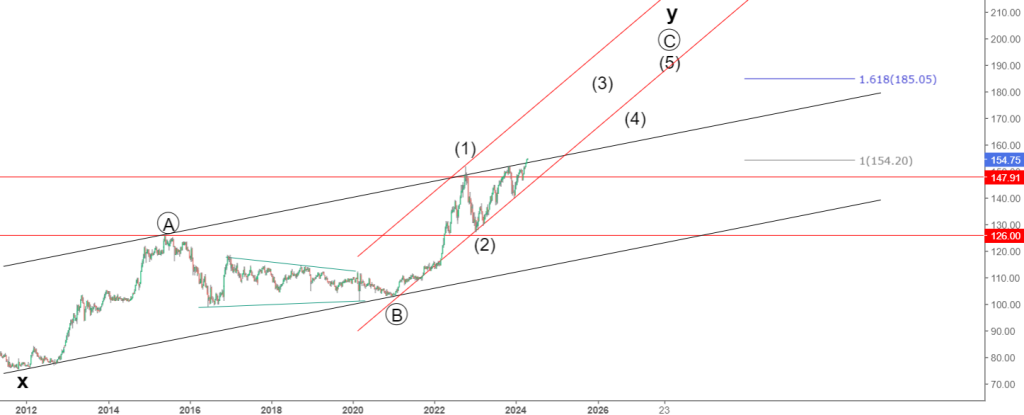
Below is a long-term chart, two channels are also marked, as in the dollar index. Now we are testing the upper boundary of the channel in black, if we pass, the acceleration in the channel will go red. Below is an important level - the lower border of the channel in red. The first goal of 154.2 can be said to have been achieved, the next one is 185.
(Click on image to enlarge)
Next, we will consider the development of the situation from the point of view of cyclic analysis. The range of minimums of the medium-term cycle is in the interval 19.04 - 07.06 . We are already in it, even if a reversal began, the top of the cycle was shown on April 15, i.e. the cycle is greatly shifted. This is a bullish signal for the dollar index. That is why option 2 for eur/usd (see above) has become less likely. There is another important level - 107.05 , while the downward reversal is not confirmed, we can still do it. In this case, the annual cycle will also be shifted; this will confirm that the minimum of the 4-year cycle was shown in July 2023, and not in the summer of this year, as expected. All these shifts will indicate a huge bullish potential for the dollar, which also correlates with the expectation of a crisis.
The last article also pointed out the importance of movements in the US debt market (more specifically the 30-year, or 10-year). The following graph was given with a comment:
Below is a chart of American 30-year notes, the same situation is in 10-year notes. It will essentially determine the movement of markets in the coming months and years. A simple scheme works: a dollar up - everything is down, a dollar down - everything is up. And a change in bond yields (long end) will indicate the direction for the dollar. As you can see, the top (5) coincided with the top on the dollar index with a small lag. The rise in yield after the end of wave (A) immediately led to its growth.
In the near future, yields are expected to rise in wave (B), which will most likely lead to a rise in the dollar and a fall in markets. If a clear upward impulse is formed in the dollar index during this period (downward in the S&P500, etc.), then we can talk about a reversal. If not, then 2 in the euro-dollar will continue and there will be another top in the S&P500. Then yields will begin to fall again, which will lead to a weakening of the dollar.
(Click on image to enlarge)
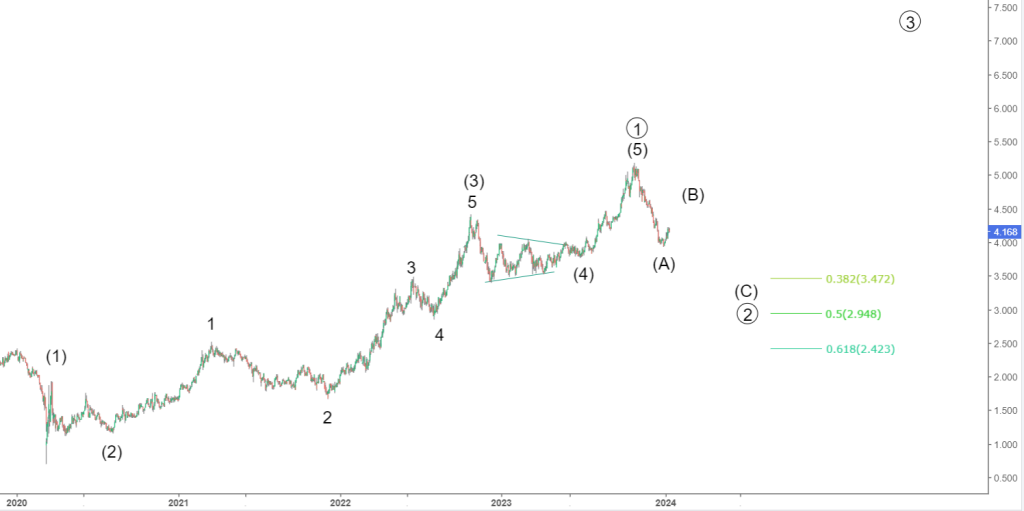
The movement in wave (B) continued, we see the results. A movement in (C) is expected to begin soon, which will coincide with a local weakening of the dollar and rising markets. A more pessimistic scenario - the downward movement (wave (A)) is not an impulse (it can, with a stretch, be considered a correction). In this case, either ((2)) has ended altogether, or we will make a flat correction, but the fall most likely will not be below 3.944. While the scenario on the chart is the main one, if (B) goes up significantly, it will be possible to switch to an alternative one.
The fundamental factors are the same; they were mentioned in previous articles.
A slight deterioration in financial conditions immediately leads to a fall in markets and a rise in the dollar.
(Click on image to enlarge)

Sentiment. Hedge funds and managers increased US dollar longs to a 5-year high. In principle, we can make a correction to remove overbought conditions. But for the future it is clearly visible (confirmed once again) that in case of any minor problems, investors flee to the dollar.
(Click on image to enlarge)

Conclusion
The development of the situation only confirms the medium and long-term positive forecast for the dollar; a correction is expected in the short term. The article notes what fundamental factors you should focus on (primarily bonds, plus the level of 107.05 on DXY). The charts also show technically important levels that you should pay attention to.
More By This Author:
Crude Oil. Midterm Outlook
The US Stock Market; Correction Before A Serious Fall
Gold And Silver. Will The Fall Continue ?
Disclaimer:


Good forecast.
Thanks!