
Daily Market Outlook - Thursday, March 20

Image Source: Pexels
Asian stocks advanced following a strong rally on Wall Street, driven by the Federal Reserve’s signal that it still expects potential interest rate cuts later this year, viewing any inflationary pressures from tariffs as temporary. MSCI’s regional stock index climbed to its highest level since early November, with notable gains in equities across Taiwan, Australia, and South Korea. US equity futures also rose during Asian trading hours after the Financial Times reported that NVIDIA plans to invest hundreds of billions of dollars in US-manufactured chips and electronics over the next four years. Japanese markets remained closed for a public holiday. The Australian dollar weakened after data revealed a surprising drop in employment, with jobs declining by 52,800 last month, contrary to forecasts of a 30,000 increase. Meanwhile, copper prices surged past $10,000 per tonne amid growing tariff concerns, and gold reached another record high. Bloomberg's dollar index edged lower, while cash Treasuries were unavailable in Asia due to Japan's market closure. In contrast to the broader regional uptrend, Chinese shares underperformed. The CSI 300 Index on the mainland fell for the first time in three days, with technology stocks leading the decline after recent gains. Hong Kong’s Hang Seng Index also slipped, dropping as much as 1%.
Geopolitical issues continued to be a significant concern for investors. On Thursday morning, Israel's military reported that it had intercepted a missile launched from Yemen amidst rising tensions with the Houthis. Trump has warned of consequences for Iran due to its alleged backing of the Yemeni militant group. The increasing hostilities in the Middle East caused oil prices to rise on Thursday. However, potential gains were tempered by the possibility of Russian supply returning to the market, following a statement from Ukrainian President Volodymyr Zelenskiy indicating that a cessation of energy strikes in the conflict with Russia could be achieved quickly. In a one-hour phone call that the White House called "fantastic," Trump and Zelenskiy agreed on Wednesday to collaborate on efforts to end Russia's war with Ukraine.
The Fed dot plot still signals two rate cuts in 2025, but the easing bias appears softer. US Treasury yields fell post-FOMC meeting as the Fed viewed inflation pressures from tariffs as transitory and announced a slower QT pace starting in April—only $5bn/month of maturing USTs will not be reinvested, down from $25bn/month. The move is framed as a technical adjustment, not a policy shift. Waller dissented on the QT decision, though the vote to hold Fed Funds at 4.25-4.5% was unanimous. The statement replaced balanced risk language with increased uncertainty, echoed by Powell. Near-term GDP forecasts were revised down (2025: 1.7% vs. 2.1% in Dec), and PCE inflation was revised up (2025: 2.7% vs. 2.5%), while long-term projections stayed steady. Median Fed Funds estimates remain unchanged, with two 25bp cuts still projected for 2025. However, a shift by two participants would have reduced this to one cut, reflecting a softer bias to ease. Powell emphasised no urgency to act.
This morning's report from the UK’s ONS reveals that the unemployment rate held steady at 4.4% for the three months leading up to January, despite stronger-than-expected employment gains being partly offset by downward revisions. Considering the known sampling issues with the Labour Force Survey, the Bank of England is unlikely to assign significant weight to this data, which the MPC likely factored into yesterday’s decision. Consequently, attention is expected to pivot toward wage growth, where signs of potential softening are emerging. First, the more up-to-date HMRC real-time data for February indicates median pay growth slowed to 5.0% year-on-year, down from 6.0% in January. Meanwhile, the more traditional metrics, which only provide data up to January, still suggest pay growth remains closer to 6% over three months/year. However, HMRC figures have historically been a reliable indicator of trends. Second, there’s reason to believe that regular pay in the private sector—the Bank of England’s preferred measure—might slightly undershoot the 6.2% three-month/year projection made by BoE staff for Q1, as outlined in the February Monetary Policy Report. The current figure of 6.1% for January over three months/year implies February and March could see monthly growth of up to 0.6% without exceeding the overall Q1 forecast. Given that recent average monthly growth has been 0.5%, this may offer some MPC members cautious optimism that inflationary pressures from the labour market are beginning to ease.
Overnight Newswire Updates of Note
- Nvidia CEO: To Spend Billions On US Chipmaking Over 4 Years
- UK Chancellor Will Not Raise Taxes In Spring Statement, Say Officials
- UK Gilts Investors Brace For Nearly £310B In Debt Sales
- Poland, UK Discuss Defence Spending As Europe Moves To Re-arm
- EU Probes BYD Plant In Hungary Over Unfair Chinese Subsidies
- Trump: Fed Should Cut Rates As Tariff Push Heats Up
- Fed Projections Show ECN Radically Changed By Trump’s Election
- China Holds Bank Benchmark Lending Rates for Fifth Month
- China’s $150B Of Property Debt Restructurings Stumble
- Australia Employment Surprise Fall In Feb, Jobless Rate Steady
- New Zealand Exits Recession As Rate Cuts Spur Growth Rebound
- Brazil Raises Interest Rates 100 Bps, Sees Smaller Hike Ahead
- Copper Hits $10,000 In Rally Fueled By Trump’s Tariff Threats
- Nike Faces Store Strike In Turkey On Top Of Online Sales Pause
(Sourced from reliable financial news outlets)
FX Options Expiries For 10am New York Cut
(1BLN+ represents larger expiries, more magnetic when trading within daily ATR)
- EUR/USD: 1.0700-05 (1.21BLN), 1.0715-25 (251M), 1.0740-50 (1.0BLN)
- 1.0790-00 (2.3BLN), 1.0805-10 (385M), 1.0850 (324M)
- 1.0860-70 (1.7BLN) 1.0875-85 (1.91BLN), 1.0900-10 (4.2BLN)
- 1.0920-30 (510M)
- USD/JPY: 145.00 (1.3BLN), 147.00 (350M), 147.80 (630M)
- 149.00 (250M), 149.40-55 (984M), 149.96-00 (963M)
- 150.15-25 (925M), 150.50-55 (391M), 150.70 (905M)
- EUR/JPY: 157.80 (378M). AUD/JPY: 93.75 (517M)
- USD/CHF: 0.8700 (350M), 0.8750 (292M), 0.8785 (290M)
- 0.8800 (419M), 0.8850-65 (515M), 0.8880-85 (310M)
- 0.8900 (384M)
- EUR/CHF: 0.9500 (277M), 0.9530 (225M), 0.9550 (581M)
- GBP/USD: 1.2840 (396M), 1.3000 (452M),
- EUR/GBP: 0.8350-60 (252M), 0.8375 (205M), 0.8400 (655M)
- AUD/USD: 0.6240-50 (843M), 0.6315-20 (274M), 0.6350 (365M)
- 0.6400-15 (2.2BLN), 0.6430 (429M)
- NZD/USD: 0.5660-70 (1.8BLN)
- USD/CAD: 1.4240-50 (305M), 1.4350-60 (549M), 1.4375 (500M)
- 1.4420-30 (915M), 1.4500 (731M)
CFTC Data As Of 14/3/25
- Speculators have significantly adjusted their positions across various financial instruments. In CBOT US Treasury Bonds futures, net short positions rose by 16,407 contracts to a total of 34,204. Similarly, CBOT US Ultrabond Treasury futures saw an increase of 19,490 contracts in net short positions, reaching 251,394. The net short position for CBOT US 2-year Treasury futures surged by 50,916 contracts to 1,222,215, while CBOT US 5-year Treasury futures experienced a significant rise of 75,006 contracts, bringing the total to 1,873,367. For CBOT US 10-year Treasury futures, the net short position increased by 25,035 contracts, now standing at 737,075.
- On the equity side, speculators reduced their S&P 500 CME net short position by 87,266 contracts, bringing it down to 204,619. Concurrently, equity fund managers trimmed their S&P 500 CME net long position by 59,714 contracts, lowering the total to 841,841.
- In the currency markets, the Japanese yen holds a net long position of 133,902 contracts, while the euro has a net long position of 13,090 contracts. The British pound reflects a net long position of 29,193 contracts, whereas the Swiss franc shows a net short position of -36,957. Meanwhile, Bitcoin maintains a net long position of 1,529 contracts..
Technical & Trade Views
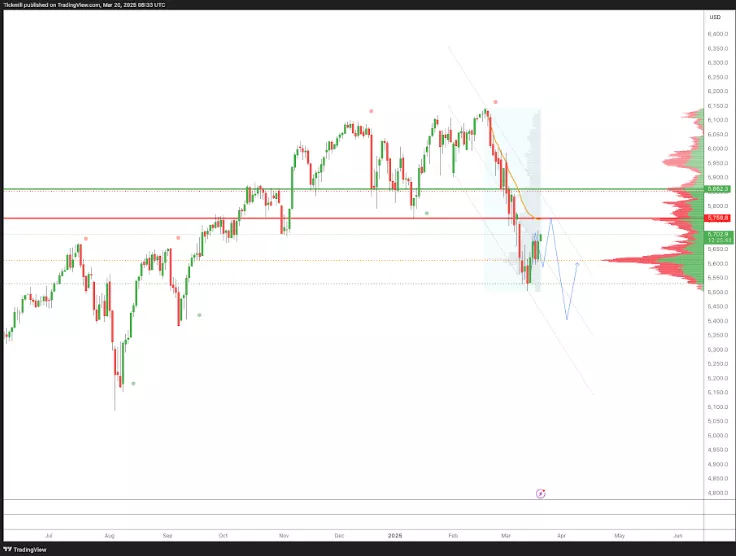
SP500 Pivot 5760
- Daily VWAP bullish
- Weekly VWAP bearish
- Seasonality suggests bullishness into late April
- Above 5865 target 5950
- Below 5755 target 5415
(Click on image to enlarge)
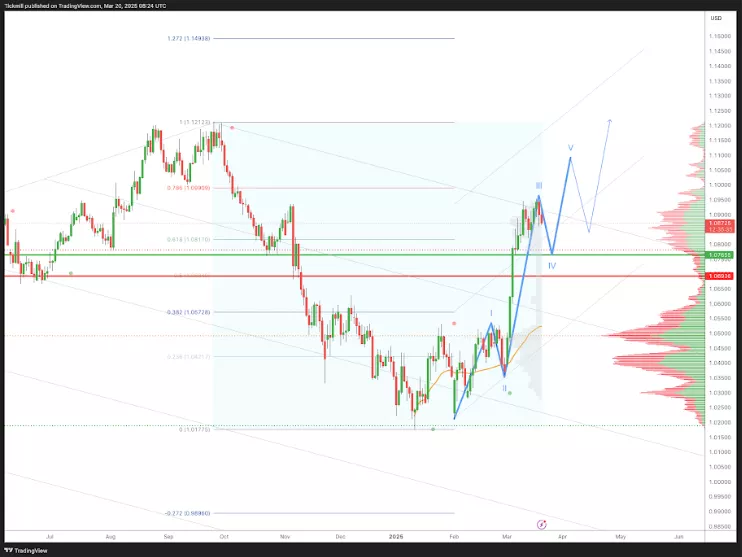
EURUSD Pivot 1.0750
- Daily VWAP bullish
- Weekly VWAP bullish
- Seasonality suggests bearishness into March 30th
- Above 1.0750 target 1.11
- Below 1.0690 target 1.0550
(Click on image to enlarge)
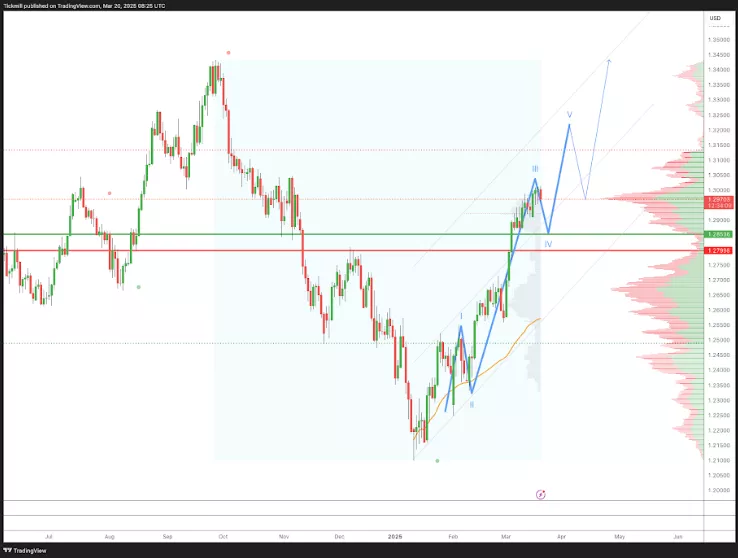
GBPUSD Pivot 1.28
- Daily VWAP bullish
- Weekly VWAP bullish
- Seasonality suggests bullishness into late April
- Above 1.2850 target 1.32
- Below 1.2790 target 1.2660
(Click on image to enlarge)
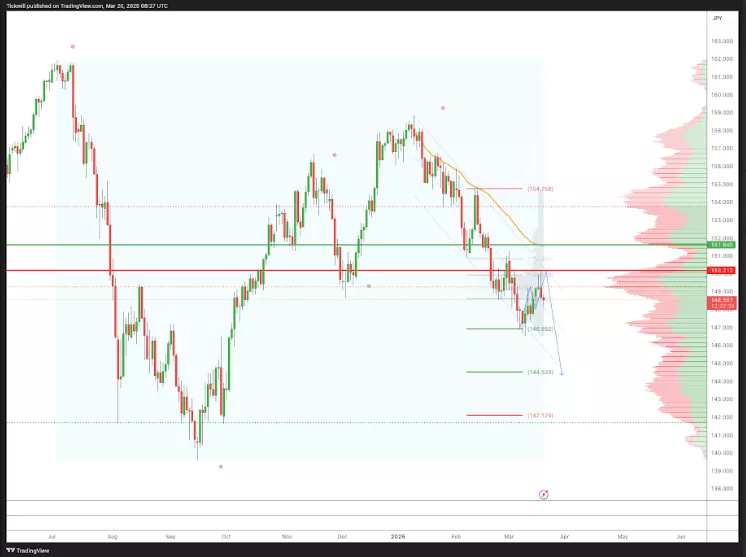
USDJPY Pivot 150.50
- Daily VWAP bearish
- Weekly VWAP bearish
- Seasonality suggests bullishness into Apr 9th
- Above 1.52 target 153.80
- Below 150.50 target 145
(Click on image to enlarge)
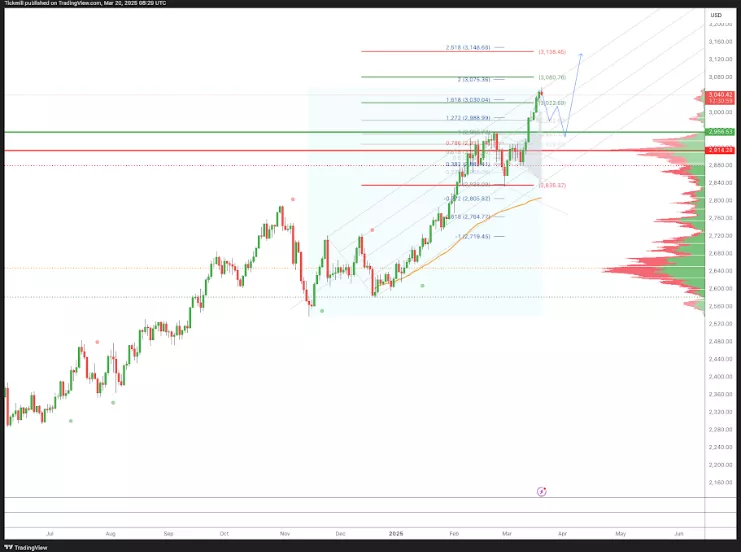
XAUUSD Pivot 2950
- Daily VWAP bullish
- Weekly VWAP bullish
- Seasonality suggests bearishness into mid/late March
- Above 2900 target 3100
- Below 2880 target 2835
(Click on image to enlarge)
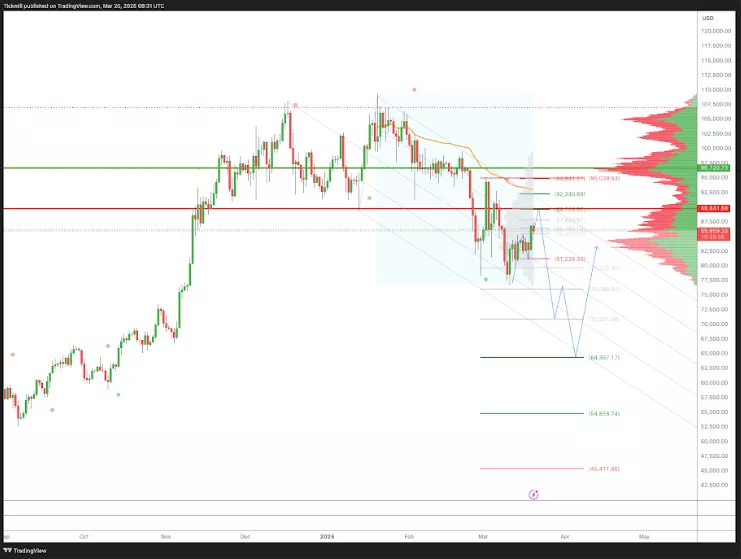
BTCUSD Pivot 90k
- Daily VWAP bullish
- Weekly VWAP bearish
- Seasonality suggests bullishness into Apr 9th
- Above 97k target 105k
- Below 95k target 65k
(Click on image to enlarge)
More By This Author:
The FTSE Finish Line - Wednesday, March 19
Daily Market Outlook - Wednesday, March 19
The FTSE Finish Line - Tuesday, March 18


