
Bitcoin Technical Analysis
BITCOIN
“A bubble is a bull market in which you don’t have a position.” Eddy Elfenbein.
“A market is never so high that in can’t go higher.” An old trader.
There is an impending volatility storm that will engulf us next year of which late 2017 has only been a prelude.
Bitcoin is a good place to start given all the euphoria and warnings that are taking place. I downloaded BTC-USD from Yahoo and here’s the chart showing my main indicator:
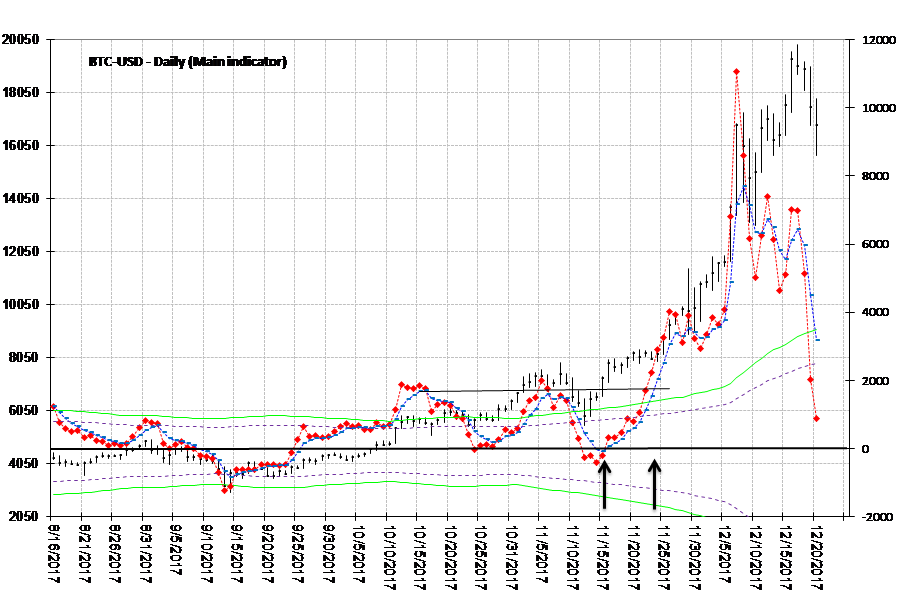
The red line is the raw indicator and the blue is the raw smoothed. Crossovers below the purple line (above zero) or above the purple line (below zero) indicate reversal but once the indicators exceed the purple and green lines other factors come into play.
There is a crossover on November 16th (first arrow) which is the signal to go long. Then on November 24th (second arrow) the smoothed indicator breaks the black horizontal line (a lower high could indicate a reversal) and the green line (indicating a trending market). When the indicators exceed the green line, we look at a shorter-term indicator for both adding to a position and the sell signal.
Here’s the short-term indicator:
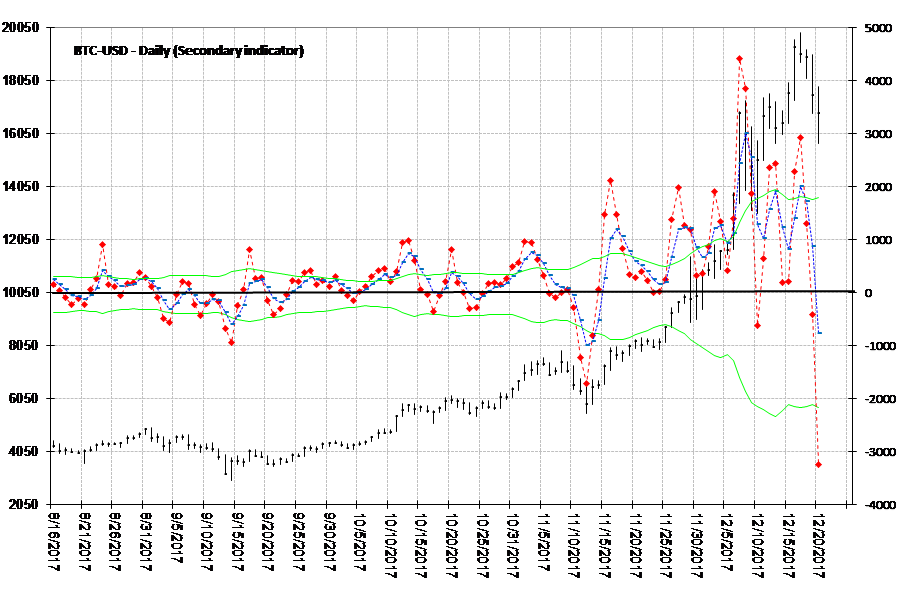
When the main indicator is trending above the green line, the sell signal is the second crossover of zero by the short-term indicator. Today’s action has given us our first crossover of zero. Now, given the volatility of this market, this first crossover could become a real doozy and cause weak hands to fold. I think it would be a mistake.
Under this system, when the red and blue lines turn back up and intersect that is the point to add to your position (if you are into pyramiding).
Related to Bitcoin, I saw an article yesterday recommending selling out of the Bitcoin Investment Trust (GBTC). If anyone owns this, I think it’s premature advice - even given its drop today. Here are the charts:
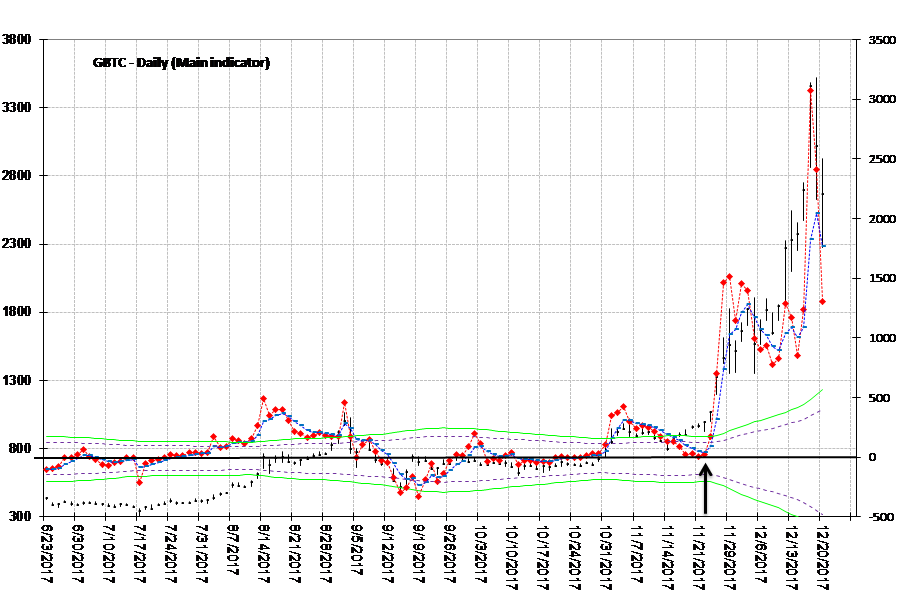
On November 27th (arrow), there’s a crossover above zero indicating another uptrend cycle and an indication to initiate a position, if you're not in the market, or to add to an existing position if you are. As the red and blue indicators have exceeded the green line, we need to look at the short-term indicator.
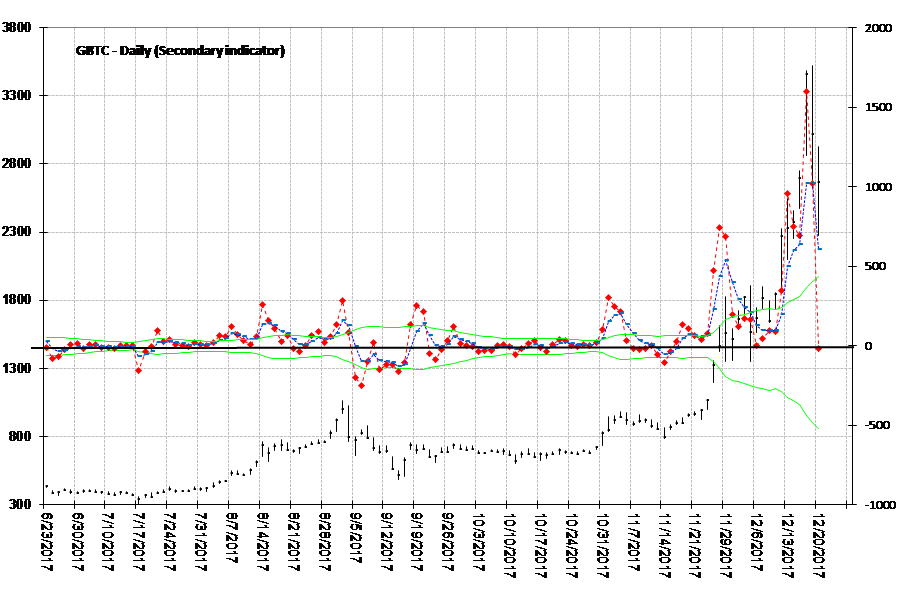
There have been no zero crossovers yet but we are getting a sharp pullback. If you are in GBTC for the longer term don’t get shaken out of your position. The next red and blue crossover will be a time to add to your position.
Disclosure: No positions in stock mentioned


How high do you think #bitcoin can go?
The rally may be over. #Bitcoin plumetted:
money.cnn.com/.../index.html
No - now it's getting interesting.
Duanne, I don't know. If you're trading, you take what your system gives you. The danger comes when you second guess your indicators.
I like the analysis because it introduces me to an indicator that can help me determine when this bubble will implode. Cannot wait to short this thing just waiting for the right technical signals so I do not get squeezed out. #bitcoin.
Michael, Always check the longer-term cycle. This is a lesson I learned and plan to write about. The shorter-term cycle can give you a sell but there's a longer-term cycle out there that negates it. I have my indicators running from 1 minute all the way up to quarterly.
Not a fan of bitcoin, eh?
Thanks @[Peter Rogers](user:5004). I'm very interested in #bitcoin and have read countless articles about it here. However, this is the first technical analysis piece I've read on the subject, which got me curious as I don't really know anything about technical analysis. Are there any easy to understand resources you can point me to, so that I can better understand and take advantage of your article on $BITCOMP and $GBTC? Thank you.
Alexis, TA is a huge and many varied area. The indicator I mentioned in the article is based one from Al Gietzen's 1992 book "Real-Time Futures Trading" (his "Advanced Cycle Trading" is the paperback version). In my spreadsheets the other indicators I use are ADX (tells me if the strength of moves), Bollinger Bands, Chaiken Money Flow and RSI. Head over to: www.investopedia.com/.../
Look around that site to get ideas.
The one blog I read first every day:
https://www.armstrongeconomics.com/blog/
check out his site. All the best.
Good info. And yes I agree about Martin Armstrong. I first learned about him right here as he is a frequent contributor to TalkMarkets. He had a good, quick post just today: www.talkmarkets.com/.../market-talk-thursday-december-21
Good analysis. Watching bitcoin lately has been more exciting than... most things I can think of!
Indeed Dan. If you like nose bleed stuff take a look at VelocityShares's new 4x leveraged ETN products:
www.etf.com/.../first-4x-products-debut-us
Absolutely nothing could go wrong...!!
Thanks for the tip @[Peter Rogers](user:5004).