Saturday, April 15, 2023 4:24 AM EST
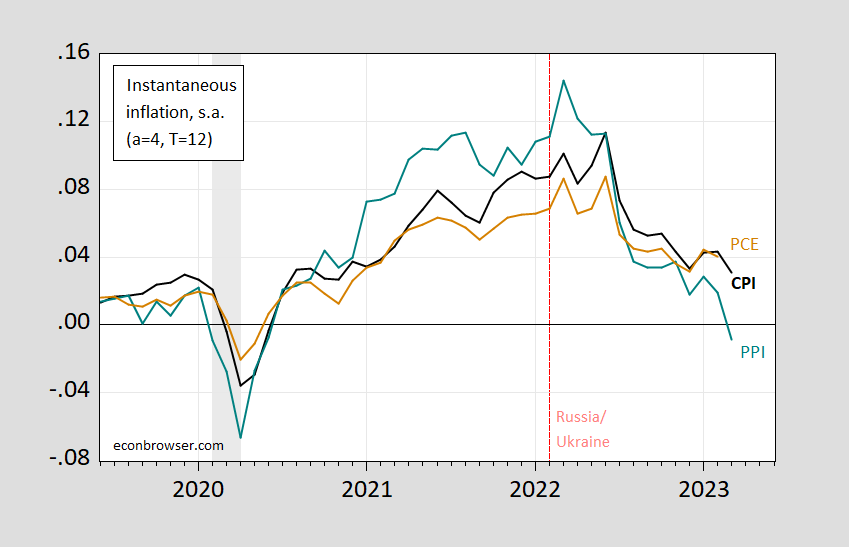
Based on Eeckhout, using a=4, T=12:
(Click on image to enlarge)

Figure 1: Instantaneous (a=4, T=12) CPI inflation (black), PPI (tan), PCE (green), following Eeckhout. NBER defined peak-to-trough recession dates shaded gray. Source: BLS, BEA via FRED, NBER, and author’s calculations.
More By This Author:
Market Expectations On Fed Funds, Spreads, Inflation Post-CPI Release
Oil Prices, Gasoline Prices
Not A Recession … Yet
Disclaimer: This information is presented for informational purposes only and does not constitute an offer to sell, or the solicitation of an offer to buy any investment products. None of the ...
more
Disclaimer: This information is presented for informational purposes only and does not constitute an offer to sell, or the solicitation of an offer to buy any investment products. None of the information herein constitutes an investment recommendation, investment advice, or an investment outlook. The opinions and conclusions contained in this report are those of the individual expressing those opinions. This information is non-tailored, non-specific information presented without regard for individual investment preferences or risk parameters. Some investments are not suitable for all investors, all investments entail risk and there can be no assurance that any investment strategy will be successful. This information is based on sources believed to be reliable and Alhambra is not responsible for errors, inaccuracies, or omissions of information. For more information contact Alhambra Investment Partners at 1-888-777-0970 or email us at info@alhambrapartners.com.
less
How did you like this article? Let us know so we can better customize your reading experience.


