
Oil prices are down, and futures are in backwardation. Gasoline prices are also (way) down from June peaks.
(Click on image to enlarge)
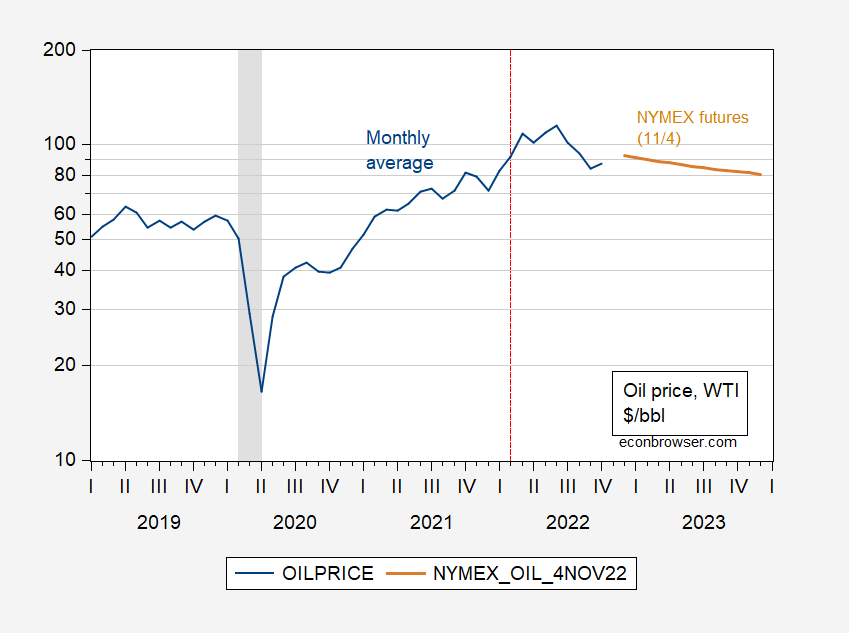
Figure 1: Oil price of WTI, monthly average (blue), and NYMEX futures price as of 11/4 (brown), $/bbl, on log scale. Source: EIA via FRED, ino.com.
While futures prices show a decline (both now, and back in October), the EIA STEO forcast from October was for price increase. Presumably, when the November STEO comes out, that pattern will persist. (That being said, statistical analyses usually indicate futures outperform most forecasts, although STEO forecasts do pretty well.)
Gasoline prices for regular have also fallen.
(Click on image to enlarge)
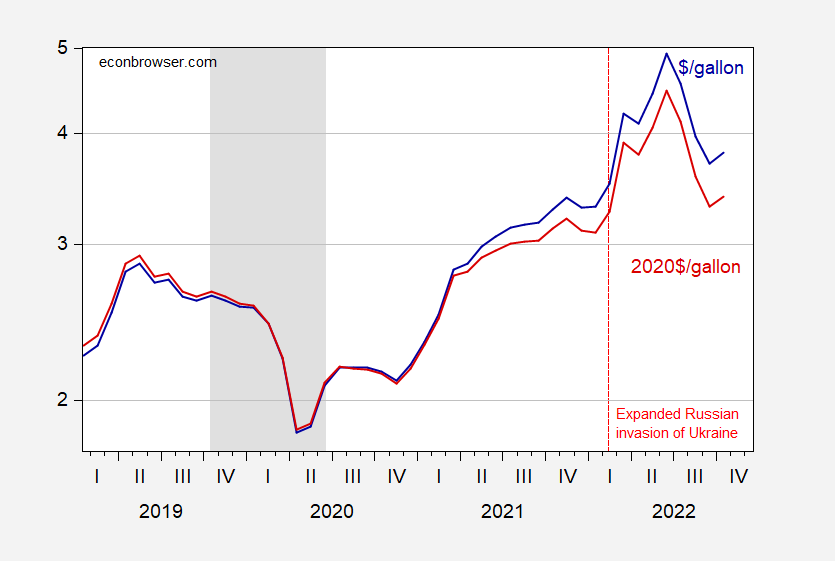
Figure 2: Price per gallon of regular, $/gallon (blue), and real price, 2020$/gallon (red), on log scale. Real price calculated using core CPI, October CPI using nowcast as of 11/4. NBER defined peak-to-trough recession dates shaded gray. Source: EIA via FRED, BLS via FRED, Cleveland Fed, NBER and author’s calculations.
More By This Author:
Not A Recession … YetGauging Recessions with the Jobs-Workers Gap
Is This A Recession?
Comments
Log in or sign up to join the conversation.