
CoT - Peek Into Future Through Futures - How Hedge Funds Are Positioned
Following futures positions of non-commercials are as of April 1, 2025.
10-year note: Currently net short 863.3k, up 53.2k.
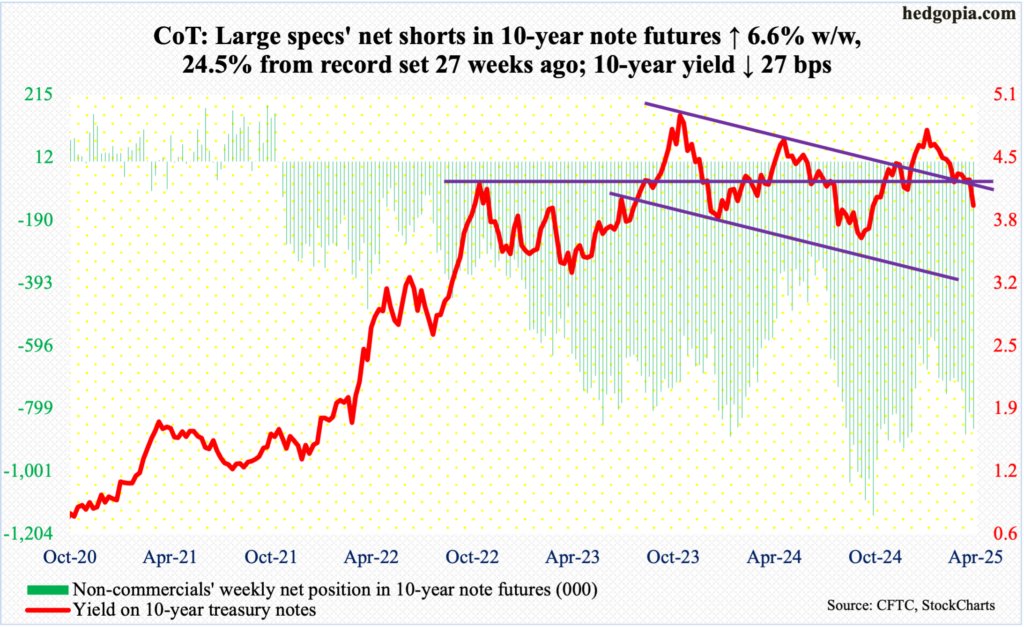
FOMC minutes for the March 18-19 meeting will be out Wednesday. The fed funds rate was left steady at a range of 425 basis points to 450 basis points during that meeting, with the quarterly statement cutting the 2025 growth rate forecast for real GDP from 2.1 percent in December to 1.7 percent and raising core inflation forecast to grow at 2.8 percent from the December forecast of 2.5 percent. Post-meeting, futures traders boosted easing expectations this year from a couple of 25-basis-point cuts going into the meeting to three. This has now gone up to four. The Donald Trump administration’s sweeping tariff policy has sown fears of trade wars, and recession odds have meaningfully gone up.
The Federal Reserve has a dual mandate: maximum employment and price stability. On the jobs front, things are holding up, albeit with signs of weakness in openings. But if the tariffs are meant to be permanent, this has the potential to throw a curve ball to this seeming stability. Tariffs essentially are a tax on business and households. Businesses will have to decide how much of the tariffs to absorb themselves and how much to pass on to the customer. Margins will take a hit, and consumers will pay higher prices. This is cost-push inflation, not demand-pull which was experienced during Covid. Many fear the US economy is headed for stagflation.
No central bank would want that, and it is too soon to conclude which one of the two mandates the Fed will focus on should this scenario come to pass. Fed Chair Jerome Powell has a tough job ahead. If the goal of the just-announced tariffs is to bring back manufacturing to US soil, then they are permanent. If instead tariffs are merely a negotiating ploy to exact better deals, then they can be temporary. Then, there is this. If the Fed decides to respond to the prevailing tariff chaos by loosening monetary policy, it will be difficult to immediately roll it back if it turns out tariffs were simply a negotiating tactic. Just to be on the safe side, unless the unemployment rate jumps, they are likely to wait as long as possible.
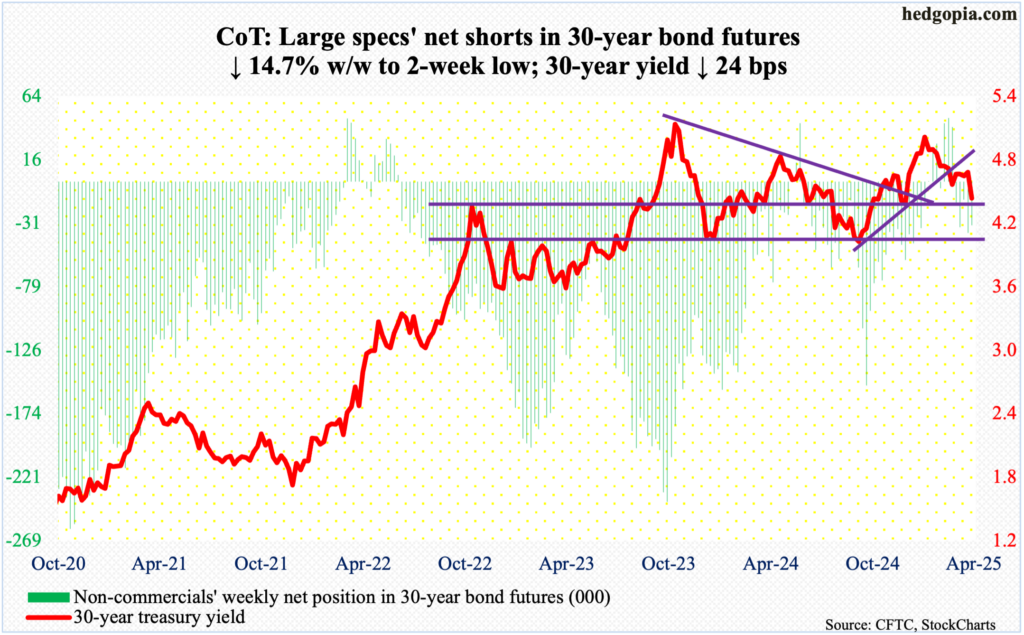
30-year bond: Currently net short 32.6k, down 5.6k.
Major US economic releases for next week are as follows.
The NFIB optimism index (March) will be published Tuesday. Small-business job openings firmed up three points month-over-month in February to 38 – a six-month high.
Thursday brings the consumer price index (March). In the 12 months to February, headline and core CPI increased 2.8 percent and 3.1 percent respectively. The two reached four-decade highs of 9.1 percent and 6.6 percent in June and September of 2022, in that order.
The producer price index (March) and the University of Michigan’s consumer sentiment index (April, preliminary) are on schedule for Friday.
From a year ago in February, headline and core wholesale prices rose 3.2 percent and 3.3 percent respectively.
Consumer confidence in March tumbled 7.7 points m/m to 57, which was the lowest since November 2022. As recently as last December, the index was 74.
WTI crude oil: Currently net long 190k, up 11.3k.
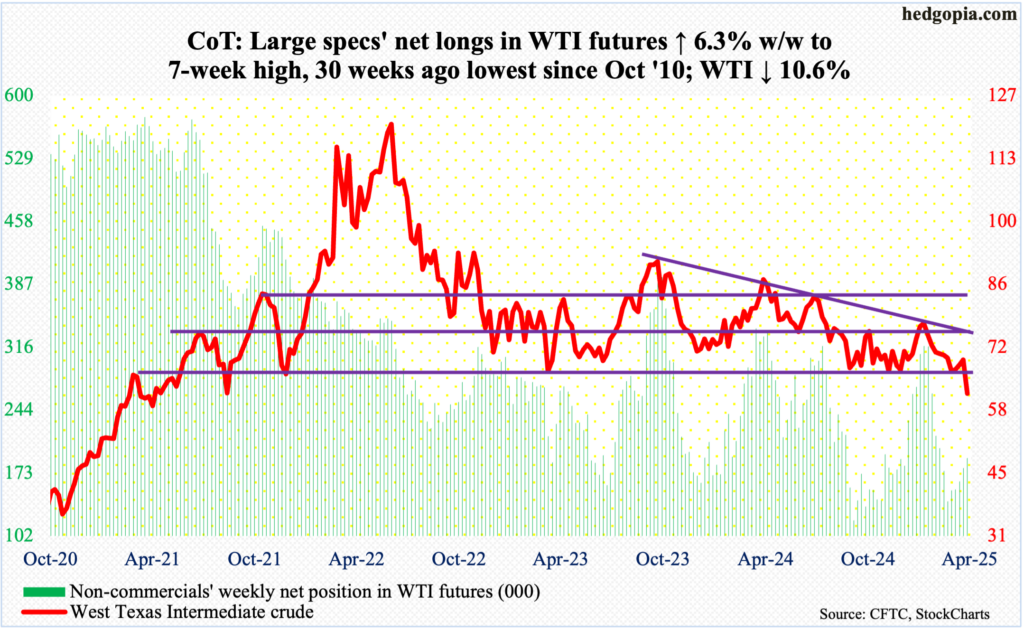
This was a one-two punch. Thursday, eight OPEC+ producers, including Saudi Arabia and Russia, decided to increase collective crude output by 411,000 barrels per day from next month. This was nearly three times the expected rise of 140,000 b/d. Then, thanks to US tariffs and growing fears of trade wars, there has been a meaningful rise in global growth fears.
West Texas Intermediate crude collapsed 10.6 percent this week to $61.99/barrel, with a crucial breakdown at horizontal support at $65-$66. This support goes back years, with buyers also having shown up there last September.
This week’s action follows three weeks of minor gains, and eight consecutive weekly declines before that. On January 15th, the crude reversed lower after tagging $79.39 intraday.
As things stand, should WTI manage to rally toward $65-$66, this will probably be used as an opportunity to lighten up. Mid- to long-term, there is horizontal support at low-$50s, and then low-$40s.
In the meantime, US crude production in the week to March 28th increased 6,000 b/d week-over-week to 13.580 million b/d; output has come under slight pressure since registering a record 13.631 mb/d in the week to December 6. Crude imports rose as well, up 271,000 b/d to 6.5 mb/d. As did stocks of crude and distillates – up 6.2 million barrels and 264,000 barrels respectively to 439.8 million barrels and 114.6 million barrels. Gasoline inventory, however, dropped 1.6 million barrels to 237.6 million barrels. Refinery utilization declined one full percentage point to 86 percent.
E-mini S&P 500: Currently net short 19k, down 34.3k.
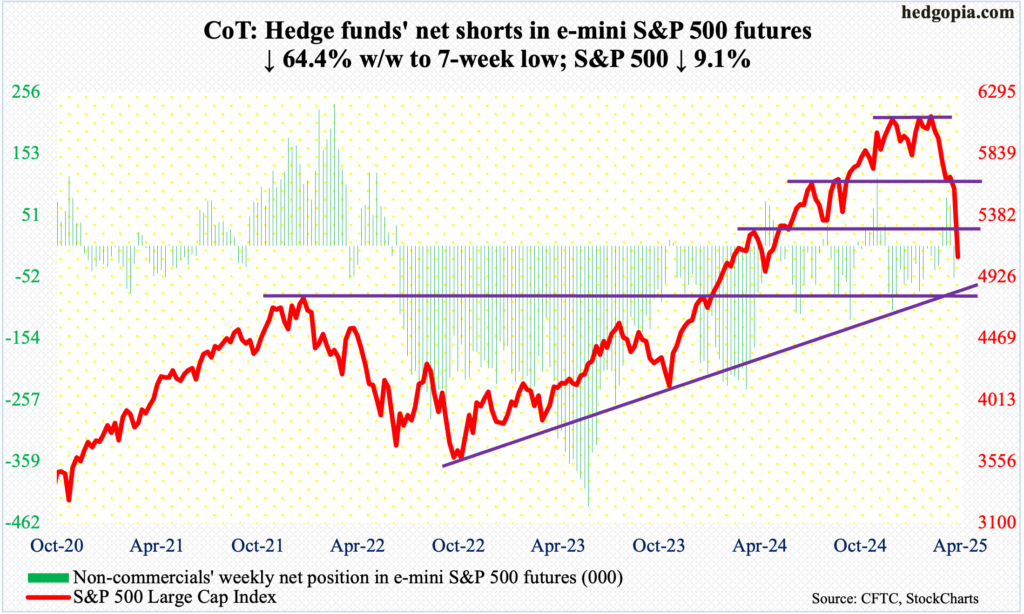
In a big thumbs-down to Trump tariffs, the S&P 500 sank 9.1 percent this week to 5074. This was the sixth down week in the last seven. The large cap index peaked on February 19th at 6147 and is now down 16.4 percent from that high. The last time it closed lower than this week’s close was last April.
One after another support level is getting breached. This week, the back-to-back gap-downs of Thursday and Friday cost the bulls 5500 and then 5260s. As a result, several technical indicators have been driven into oversold territory; this includes the RSI – both daily and weekly. But, right here, it is akin to trying to catch a falling knife.
For stability, important levels need to hold. There is one right around here. On a closing basis, a rising trendline from the October 2022 low extends to 5000. Should this hold, sellers are likely to get active at gap-down resistance just under 5300.
Euro: Currently net long 51.8k, down 13.7k.
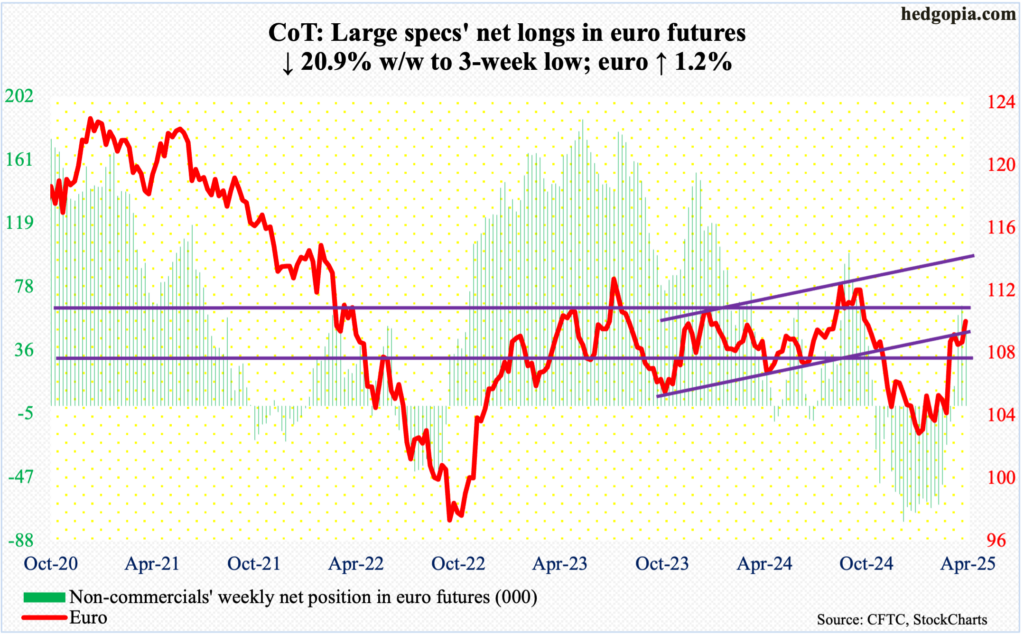
Last September, on the 30th, the euro reversed lower after facing rejection at $1.12 for six consecutive weeks. Subsequently, it stabilized early this year around $1.02s, which was defended for a whole month. A rally ensued, and it culminated this week in Thursday’s intraday high of $1.1147. Friday, too, the currency ticked $1.1108 before reversing lower 0.7 percent to $1.0964, still up 1.2 percent for the week.
For now, the path of least resistance is down. If euro bulls prevail near term, they may be able to once again go and test $1.12, but this is likely to end in a failure, as was the case last September.
Gold: Currently net long 238.4k, down 11.4k.
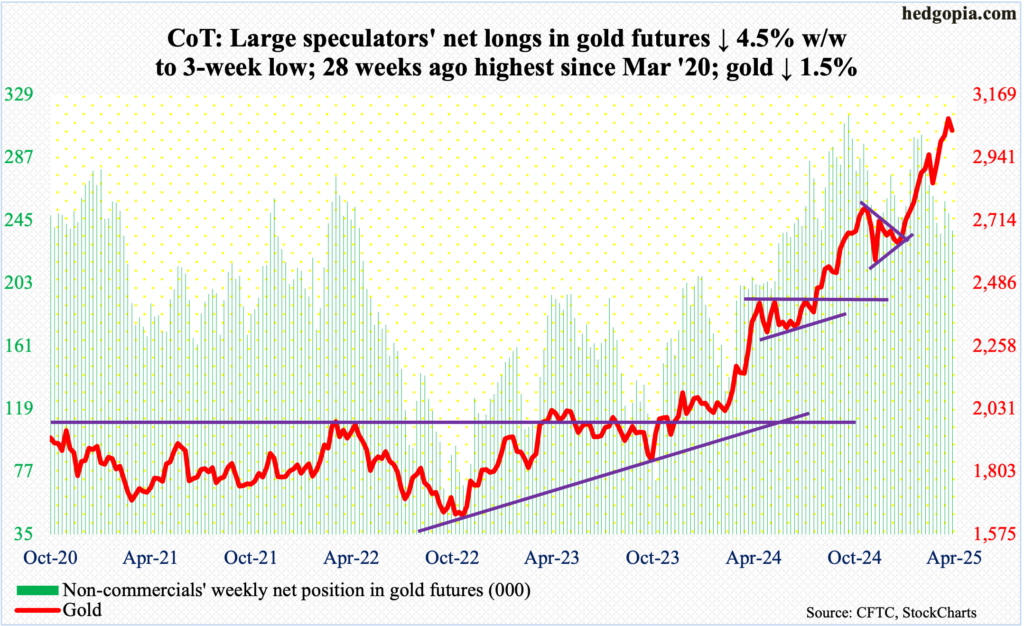
Gold has been rallying since December 30th last year when it ticked $2,608. Going into this week, it had rallied for 12 out of 13 weeks. If this week’s highs held, the positive momentum would have extended to 13 out of 14, but that was not to be. The yellow metal reversed lower after tagging $3,164 on Thursday, and the reversal took place in a risk-off week. For the week, it fell 1.4 percent to $3,040/ounce and was up 2.6 percent at Thursday’s fresh all-time high.
Before this week’s reversal, gold has remained extended on nearly all timeframes. It just about went parabolic for over a year. In February last year, the yellow metal touched $1,984. Unwinding probably lies ahead.
In the event of selling pressure, a lot depends on if gold bugs will be able to defend $3,000 and $2,940s-50s after that.
Nasdaq (mini): Currently net long 15.2k, up 6.5k.
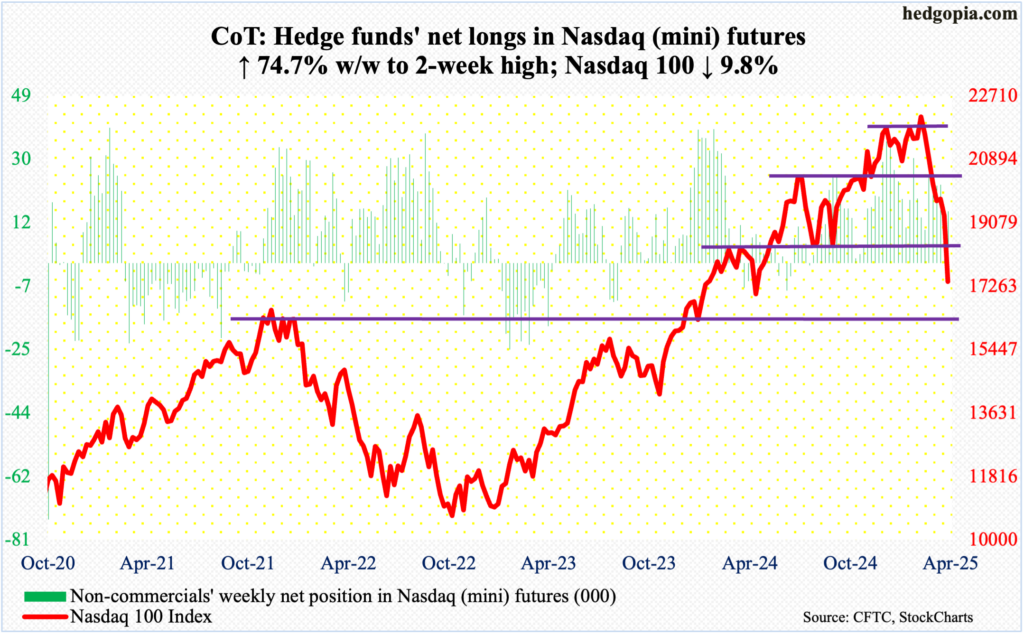
Leading up to this week’s 9.8-percent nosedive, tech bears aggressively showed up last week at the 200-day moving average, which was breached in the first week of March. From the February 19th all-time high of 22223 to this week’s close of 17398, the Nasdaq 100 has now plunged 21.7 percent.
Tech stocks are not only pricing in tariff retaliatory risks but also growing odds of a recession; plus, risks of a digital services tax in Europe are on the rise.
Given the magnitude of the drop, a relief rally is possible anytime. But selling needs to stop for that to happen. In the event of buying interest, there is gap-down resistance at 18100s, followed by horizontal resistance at 18400s.
Russell 2000 mini-index: Currently net short 17.2k, up 1.8k.
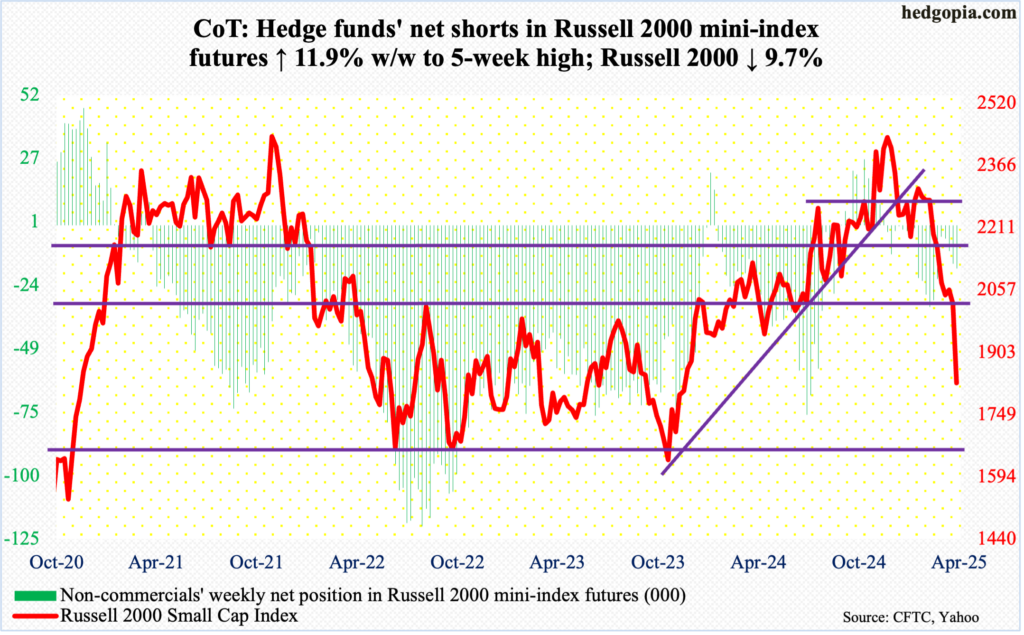
Unlike its large-cap cousins like the S&P 500 and Nasdaq 100, the Russell 2000 peaked as far back as last November when on the 25th a new all-time high of 2466 edged past the prior high of 2459 from November 2021. It has been all downhill since.
This week, the small cap index plummeted 9.7 percent to 1827; at Friday’s intraday low of 1786, it was down 11.7 percent. From last November’s high, the Russell 2000 has now toppled 25.9 percent. On the way down, small-cap bulls were unable to defend several support zones, including 2260s, 2100 and 2000.
For a couple of years through April last year, the index was rangebound between 1700 and 1900 before breaking out. This week, it sliced through 1900 on Friday, raising the possibility of a test of 1700 at some point.
For now, bulls are probably happy that the index rallied 2.3 percent Friday off the session low.
US Dollar Index: Currently net long 7k, down 427.
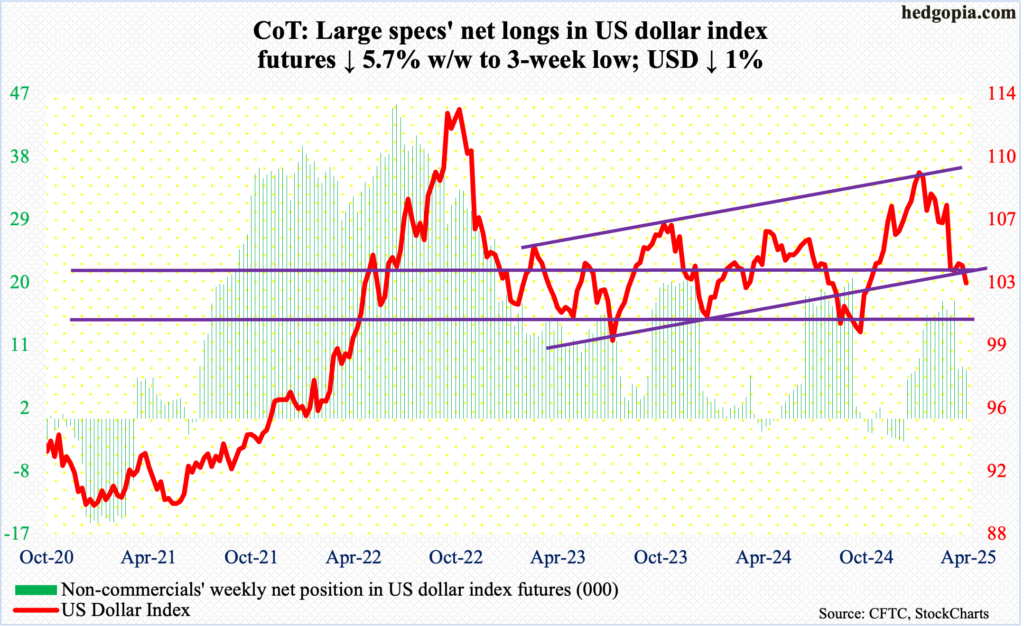
Historically, the dollar tends to strengthen when the US economy is expanding or when risk-off sentiment is strong. Both Thursday and Friday, risk assets sold off hard. Yet, the US dollar index slumped 1.4 percent on Thursday and was down as much as 2.2 percent intraday; the downward momentum continued early on Friday as the index was down another 0.6 percent before bids showed up to end the session up 0.9 percent to 102.99. For the week, the index dropped one percent, although it recovered from down 2.7 percent at Thursday’s low of 101.27. Friday’s low was 101.54.
There is multi-year support just north of 100. Near-term, the worst that could happen is a drop toward 100, which is unlikely to yield right away. The US dollar index peaked on January 13th at a two-plus-year intraday high of 110.18.
A relief rally is possible. Dollar bulls need to reclaim 103.20s for a rally to sustain. After that comes a bigger hurdle at 104-105.
Longer-term, there could be a message in the index’s inability to rally this week, which is that markets are probably betting that a lower US trade deficit would result in fewer dollars overseas which would then mean reduced demand for US assets.
VIX: Currently net short 10.4k, up 1.4k.
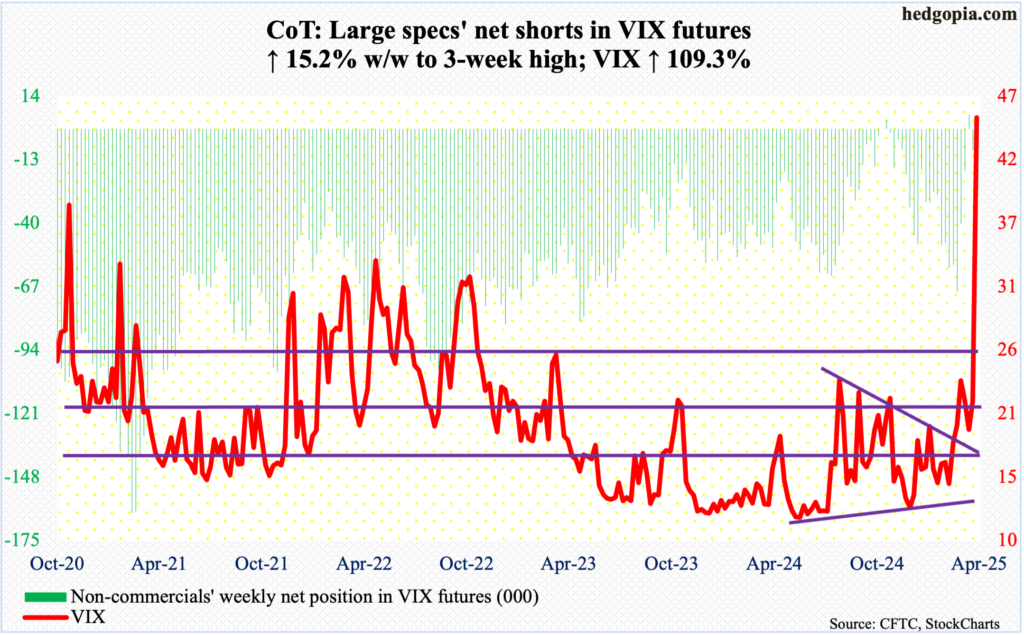
Last August, VIX rallied as high as 65.73. This week, the volatility index tagged 45.61. These represent very high levels of volatility. The difference between the two is that last august VIX witnessed a spike reversal in the same week it posted that high; this time around, the gains are kept as it finished the week up 23.66 points to 45.31, closing near the weekly highs.
Should VIX reverse lower in the sessions ahead, there are two levels to watch at this point: 28-29 and 22-23.
Thanks for reading!
More By This Author:
Amidst Corporate Buybacks And Margin Debt Dynamics
CoT: Peek Into Future Through Futures, How Hedge Funds Are Positioned - Sunday, March 30
After Low-Double-Digit Declines From Feb Highs, Large-Cap Indices In Process Of Bottoming


