
Tuesday Talk: All About Oil
As the Russian invasion into Ukraine enters its third week, the price of oil continues to rise and stock markets continue to fall.

In yesterday's trading in New York all 3 major indices closed down. The S&P 500 closed at 4,201, down 127 points or 2.95%, the Dow closed at 32,817, down 797 points or 2.37% and the Nasdaq Composite closed at 12,831, down 482 points or 3.62%. Amongst all the red, Monday's top gainers were all all Energy sector issues, save for fertilizer manufacturer, CF Industries Holdings and gold producer Newmont.
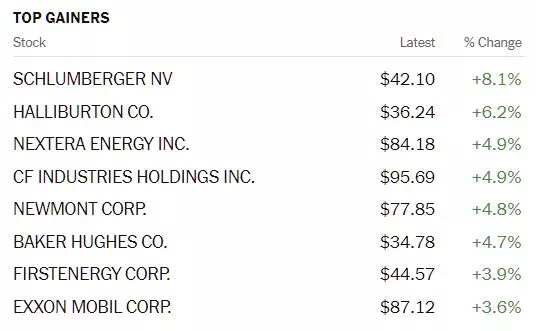
Chart: The New York Times
Market futures are green in early morning trading. S&P futures are trading up 13 points, Dow futures are trading up 81 points and Nasdaq 100 futures are trading up 8 points. In Oil, Brent crude is currently trading at $126.60 per barrel.
It's all about war, commodities and oil prices right now. TM contributor Mircea Vasiu notes WTI Crude Oil Price Keeps Surging, Trading Above $122/barrel: What Do Charts Say?

Photo by Delfino Barboza on Unsplash
"One of the side effects of the conflict in Ukraine is the surge in the price of commodities. Oil, for instance, is now trading above $122/barrel, as stunning developments in the macro world led to a massive short squeeze...A daily close above $100 was the signal that the price would keep on rising. Finally, a pennant is seen at $110, and now the market trades at $122.
While above $100/barrel, the WTI crude oil price remains bullish. Only a daily drop before the pivotal level would signal a change in the rising trend.
For financial markets and not only, such elevated levels in the price of oil suggests that inflation will further squeeze households’ real income. With the Fed on track to deliver a rate hike to stem inflation, steady oil prices may trigger some more action from the biggest central bank in the world."
Contributor Brad Thomas asks Is Oil Headed To $200 Per Barrel This Month?
"I don’t know if you noticed yesterday, but West Texas Intermediate crude futures jumped to $130.50 per barrel.
They retreated to $123.09 from there. But that kind of activity isn’t exactly the greatest sign of where the oil market is headed.
Likewise, Brent crude futures reached $139.13 before “dropping” to $126.30.
I know I reported on California gas prices a few workdays ago – which have now hit $5.28 per gallon on average – but it’s not alone in paying $4 or more at the pump now. The national average is officially $4, its highest price point in almost 14 years...Moreover, “as banks stop working with Russia… it changes the trade lines going on”. So much so that, as Bloomberg reports, some oil traders are betting on $200-a-barrel oil by the end of March."
TalkMarkets contributor Diego Colman comments that the Nasdaq 100 Plunges Into Bear Market As Oil Price Surge Kindles Stagflation Worries.
"Although the February jobs report released on Friday was undeniably strong and encouraging thanks in part to the rapid decline in COVID-19 cases, investors took little comfort in the data, as the ongoing crisis in Eastern Europe occupied everyone's mind.
At the start of this week, the situation is no better, in fact, the mood is rapidly souring with stocks down across the board. In this context, the Nasdaq 100 plummeted 3.75% to 13,319 on Monday amid heavy selling activity in the tech sector, posting its biggest drop since early last month and plunging into bear market, a situation in which the underlying asset has fallen 20% or more from a recent high."
"WTI and Brent have risen by approximately 25% in March alone and are trading at their highest level since 2008. While it is not yet time to panic, it is important to understand that current events are likely to accelerate inflationary pressures and weigh on economic activity via the sentiment channel and through demand destruction stemming from higher raw material costs."
" I’d be inclined to increase exposure to energy, metals and agricultural commodities given their constructive profile (USO, XOP, WEAT, DBB, DBA look attractive for tactical plays). The latter trade can perform well if current or new sanctions on Russia curtail its exports dramatically, exacerbating supply-demand imbalances for raw materials (Russia is a commodity powerhouse)."
"Turning our attention to the Nasdaq 100, the index has officially entered bear market as mentioned before. That said, the technical picture is not pretty for the tech benchmark, especially after the development of a death cross on the daily chart last week. With sentiment extremely fragile and elevated market volatility, dip buyers will be reluctant to step in to pick up risk assets despite depressed prices."
Nasdaq 100 Technical Chart
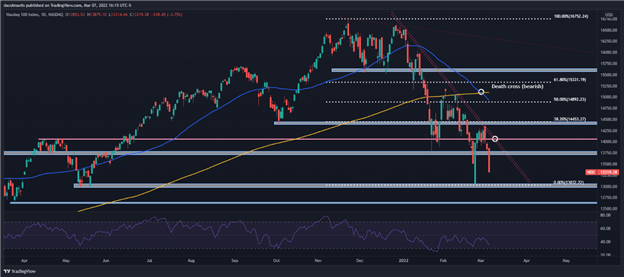
"However, it is important to underscore a critical point: if the military conflict in Eastern Europe de-escalates and sentiment improves, we may see a furious rally in the Nasdaq 100 considering how much it has fallen in 2022 and its oversold condition. In the event of a bullish reversal, resistance is seen at 13,750 and then at 14,000. If price manages to clear these hurdles, the next upside target appears around 14,453, the 38.2% Fibonacci retracement of the November 2021/February 2022 decline."
Contributor Andrew Pease has written a short primer answering the question, How Is The Russian Invasion Impacting The Economic Cycle?
"First and foremost, the invasion of Ukraine is a humanitarian tragedy. But its implications certainly spread beyond the region. The main cycle risks for the global economy center on:
- Energy prices and the impact on global growth and inflation
- Food prices, given Russia and Ukraine’s importance in global wheat and corn exports
- Supply chain disruption, particularly for motor vehicle parts and semiconductor production
The risk of a high-impact tail event rises, if one of the following events occur:
- The war expands to a neighboring NATO country, causing NATO’s Article 5 to be invoked. This article holds that an attack on one NATO member is an attack on all members. The logic of mutually assured destruction between nuclear powers makes this a low probability event. Russian President Vladimir Putin, on Feb, 27, put his nuclear forces on special alert, but this seems to be a threat to limit Western intervention rather than a signal of Russia’s intention to extend the war beyond Ukraine.
- There is a nuclear event within Ukraine. The bombing of Europe’s largest nuclear reactor at Zaporizhzhia demonstrates the threat. There is also the risk that Russia uses small-scale tactical nuclear weapons on the battlefield. This seems unthinkable for most people in the West, but some military analysts argue that the Russian military has a lower threshold for deploying these weapons.
- There is a Russian cyberattack against the West that targets financial institutions and critical infrastructure such as power supply. Data from Microsoft suggests that Russia was responsible for 60% of state-sponsored cyberattacks in 2021."
In the article Pease takes deeper dives, replete with graphs and charts, into the bullets above and they are worth a look. Despite all the reported gloom and doom, Pease is cautiously optimistic and draws the following bottom line:
"The war in Ukraine will likely have a negative impact on growth and cause higher inflation this year, with Europe taking the biggest hit. We believe growth should recover in the second half of the year. This depends on oil prices declining later in the year as supply increases, and Europe maintaining access to Russian natural gas exports. There are downside risks to this central scenario and some low-probability-but-high-impact tail scenarios. Sentiment is becoming more oversold, but cycle uncertainty places a high threshold on a risk-on call."
In the "How To Invest In These Difficult Times Department" contributor Herb Blank writing in a TalkMarkets exclusive article offers some suggestions regarding Wealth Preservation, Income And Growth Objectives In A Black Swan Environment.

"The table below lists data in pertinent categories for all 11 ETFs explained above as well as two benchmarks, SPY, the original SPDR owning the S&P 500 Index portfolio is a standard equity benchmark ETF. We also include AGG, the iShares Core Aggregate Bond ETF, the oldest bond ETF, because many of the derivatives-based ETFs benchmark themselves against the traditional 60/40 stocks-to-bond ratio portfolio. SPY and AGG are considered the standards by most professionals because they have the most Assets Under Management and the deepest liquidity."
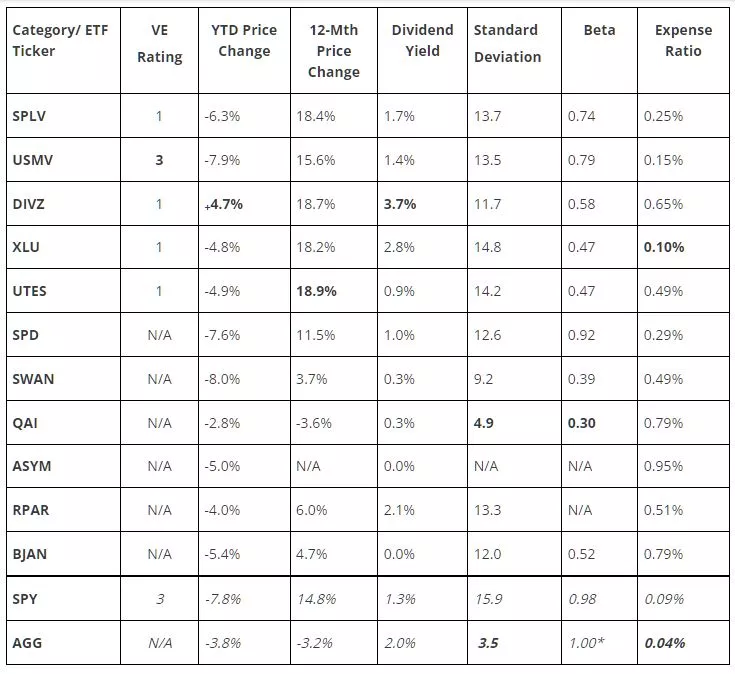
"Key Findings:
1. All 11 ETFs, the five that contain volatility through equity selection without derivatives and the six that employ derivatives to varying extents, delivered in terms of the two risk measures. They all posted betas and standard deviations lower than the S&P 500. This is in line with the expectations that their websites try to convey to investors. The lowest beta and standard deviation overall belong to market-neutral QAI.
2. The 5 stock ETFs all outperformed SPY for the past 12 months while the 5 derivative-based and risk-managed ETFs with at least 12 months of history produced less than 50% of the price return of the S&P 500. Of the latter group, only RPAR had a higher dividend yield. During the YTD downturn, only DIVZ delivered positive performance. SWAN and QAI particularly disappointed their investors. SWAN contains Black Swan in its name, but the current Russian-invasion-influenced downturn is most certainly a Black Swan event and the runaway inflation may qualify in most minds as well after 40 years of manageable price inflation. The bottom line is that SWAN did not hold up in the Black Swan political and macroeconomic environments. QAI delivered on its relative market neutrality in the YTD time frame but its very disappointing 12-month performance, negative in a positive market, and underperforming even the negative performance of AGG was not what investors expected from this ETF. USMV also disappointed YTD with a performance even more negative than that of SPY but made up for that somewhat with a market beating performance over 12 months.
3. The two actively managed ETFs, DIVZ and UTES were the best performers on a combined time frame basis relative to SPY.DIVZ was spectacular in the downturn posting a 4% positive return in the negative market, one of the top 5 non-leveraged ETFs covered by ETF.com. Its 390 (18.7% - 14.9%) relative to SPY for the 12-month period was second only to UTES among our group of ETFs. As a bonus, the dividend yield DIVZ of 3.7% was close to twice of the 2.0% yield of AGG and three times the 1.3% yield available from the S&P 500. Given that UTES operates in the utility sector, income investors will be disappointed to learn that its yield is a paltry 0.9% and may prefer XLU with a 2.8% yield, comparable performance numbers, and a much lower expense ratio.
4. SPLV, INVESCO Low Volatility S&P 500 ETF performed better than expectations and the other low-vol indexed ETF, USMV. It delivered better than index performance in both the “black swan” period in which we are still immersed and during the past 12 months as well.
5. ValuEngine’s ratings for the next 12 months expect underperformance for the four low-vol equity and utility sector ETFs that held up well and expects only USMV to perform in line with SPY.
6. The derivative-based ETFs engineered to preserve capital during downturns while participating significantly in upturns did not achieve these objective as well as the low-vol and utility sector equity ETFs. Simplify’s SPD put strategy saved just an 0.2% return differential vs. SPY YTD but easily registered the best performance of these ETFs during the past 12 months. SPD returned 11.7%, not as strong as SPY but nearly double second-place finisher RPAR. As a quant, the ASPY strategy is very intriguing but since the ETF is less than twelve months old, we’ll need more data before we can evaluate it.
7. RPAR outperformed BJAN in both YTD and in the twelve-month period on a price basis. The difference is greater on a total return basis since BJAN has a zero-dividend yield in contrast to 2.1% for BJAN. Since the ETFs have similar objectives and RPAR has lower fees and what I find to be a more comprehensive risk management methodology, I personally find RPAR more attractive than BJAN.
In summary, the nature of Black Swan events is such that I would not extrapolate too much from these comparisons. Again, I’m not certain whether the inflation spike with related macroeconomic implications qualifies as a Black Swan event. I have no doubts that the Russian Invasion and the accompanying oil price shocks definitely qualify. In such an environment, all 11 of these ETFs are worthy of research. Most of these are solid and well-constructed products for deployment in risk-on and risk-alert environments. The fact that both actively managed ETFs held up so well provides more evidence for the belief that while a cap-weighted index core holding is best in risk-on environments, active management and active asset allocation are better suited to hold up in significant downturns. In conclusion, there are some good reasons to consider diverting 20% - 30% of core index fund money to vehicles that put safety over price gains. My personal choices now would include RPAR, DIVZ, XLU, UTES and QAI."
Caveat Emptor, as always.
Until Thursday, have a good week.

Contribute to Ukrainian Relief Efforts


Now that the US is banning Russian oil importers, it will only get worse.