The Gold Update: Gold’s Short Trend Nearing Its End
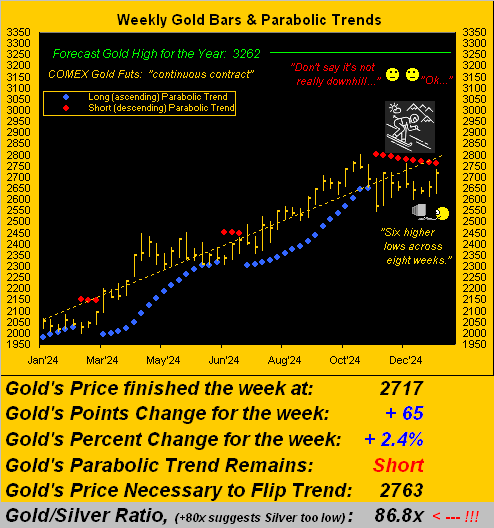
More to the point, Gold settled this past week at 2717: that is +25 points above the current Short trend’s confirmation for initial entry back at the open on 11 November, the price then 2692; (in other words again for you WestPalmBeachers, in this case down has been up).
Further, Gold’s “expected weekly trading range” is now 87 points. So for those of you scoring at home, given Gold’s current 2717 price, the graphic’s flip-to-Long level of 2763 (+46 points from here) is well “within range” such that in a week’s time this Short trend can have reached its end.And once that occurs — be it in one or possibly more weeks — Gold’s 2025 drive to 3000 shall come alive. Then in turn, our year’s forecast high for 3262 is that for which to strive.
‘Course as you seasoned traders understand all too well, going contra-trend (oft to referred as “jumping the gun”) can lead to one’s own end.For until the present Short trend actually confirms having flipped to Long, Short remains Short. And whilst we regularly quip that “Shorting Gold is a bad idea”, should December’s inflation data pop in this ensuing week’s economic reports, Gold likely reverts lower, again as we’ve mused with the upper 2400s reasonably in the balance.(Recall a week ago in forecasting the 3262 high for this year our method as well measured a year’s low ’round 2507).
All that said, Gold fundamentally is in a “Long trend” as clearly depicted in the opening Scoreboard’s righthand panel, price seemingly straining upward toward the StateSide Money Supply’s (“M2”) green line.Specifically today at 2717, Gold is priced at 71% of its 3818 Dollar debasement valuation, even as rightly adjusted for the increase in the supply of the yellow metal itself.
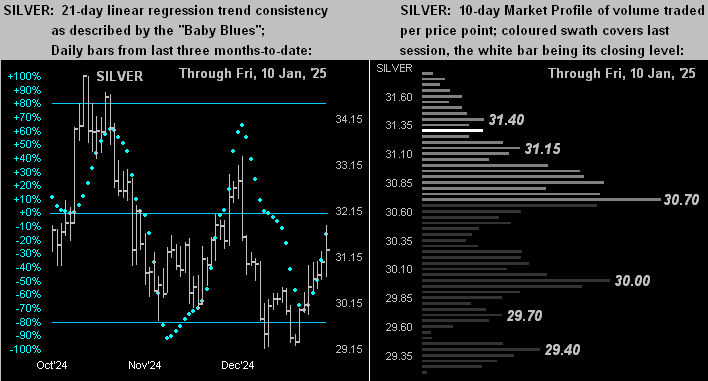
And let us not overlook the white metal. Silver settled the week at 31.30.And as noted at the foot of the above graphic, the Gold/Silver ratio is 86.8x. The ratio’s century-to-date average is 68.7x: so priced to that average today puts Silver +26% higher at 39.58.Moreover, were Gold today priced at its debasement valuation level of 3818 with the Gold/Silver ratio at that 68.7x average, Silver’s price equivalent is +78% higher at 55.60.Reprise: Do not forget the Silver!
“But mmb, with down being up, what is one to do?Just sit and wait for higher Gold?”
A super “tee-up” question there, Squire.Buying Gold, holding Gold and just putting it securely away is the quintessential conservative play.But if “trade one must”, let’s share with you a little internal thrust.
Should you regularly engage the website, you are aware of its “Market Rhythms” page which, when conversing with folks, we sometimes refer to as “The Goldmine”, albeit ’tis 100% based on what’s already happened.(No one in this business ever “knows” what’s going to happen).But to Squire’s question, one can peruse the Market Rhythms page to see what technical studies of late have been — in hindsight — attractive.And on the list amongst 11 studies currently listed for Gold is its one-hour Price Oscillator; (assuming you have an exchange-subscribed data broadcasting system and/or graphics trading platform, you can display this technical study).
Now for the purposes of today’s missive, we’ve simplified its recent results.Since 05 December (15:00 GMT) there have been 10 pure swing signals alternating ’round and ’round from Short-to-Long-to-Short-etc, the current signal being Long since last Tuesday at 06:00 GMT.Below, the green line depicts in hindsight the study’s cumulative profit/loss were one to have purely swung electronically with Globex on one Gold COMEX February 2025 futures contract.‘Tis not bad, however as therein stated it shan’t last:market dynamics — indeed the ebb, flow and timing thereto — are constantly shifting.So trader beware, but of late ’tis there:
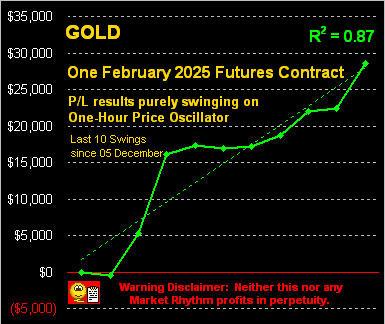
“Still, mmb, that looks pretty amazing!”
Which, dear Squire, is why ’tis said some 90% of futures traders lose it all.For once they think they’ve “figured it out”, it stops working.Or to quote George Peppard consoling Ralph Manza: “It’s a rough game for amateurs” –[“Detour to Nowhere”, Universal, ’72]. For in due course, the performance in the above graphic will stop working:’tis merely about “The When”. The Market Rhythms page is thus updated daily because those studies currently listed inevitably turn to failure, the list repopulating to present what’s been working best.
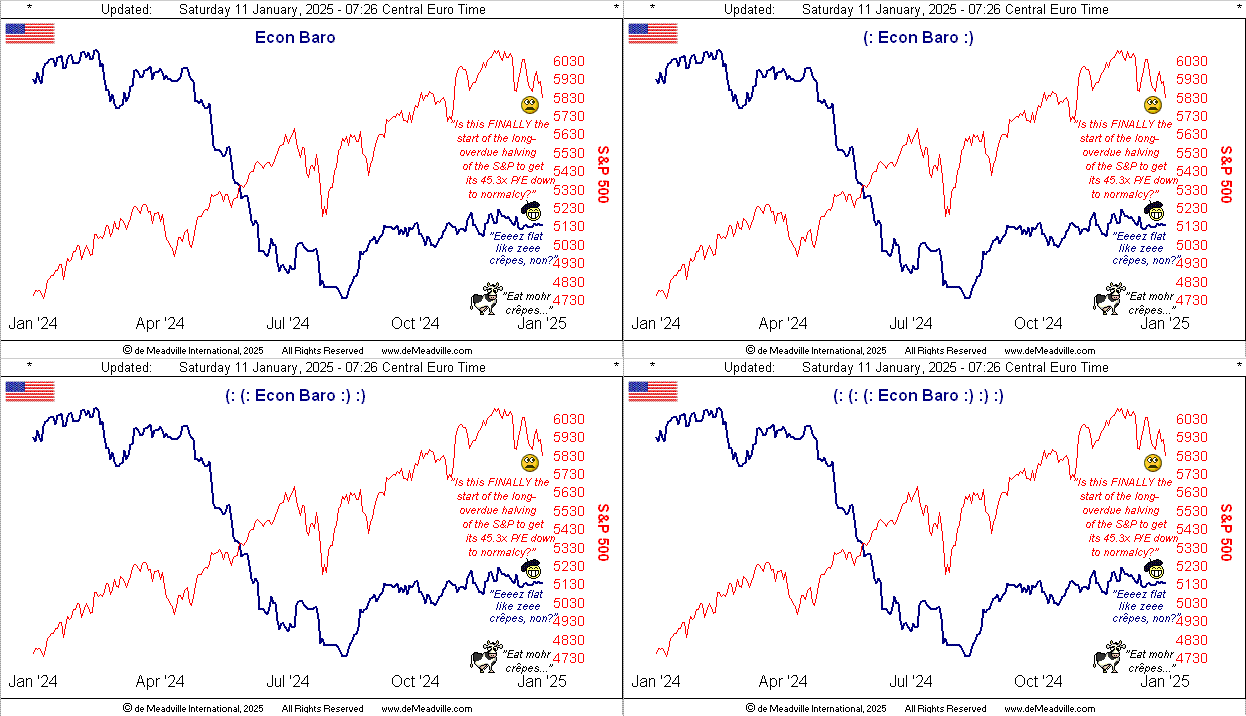
As to currently assess the Economic Barometer, ’tis neither failure nor feast:rather, ’tis flat. Cue the crowd: “How flat is it?” The range of the Econ Baro across the past 10 S&P 500 trading days is the flattest recorded since that ending 08 May 2019.Still this time ’round, since Boxing Day the Baro has taken in 18 metrics for which period-over-period nine improved … meaning nine did not do so.We thus present the El Phlato Baro:
And having earlier alluded to next week’s December inflation data, the month’s Non-Farm Payrolls net creation of 256,000 — the best since last March’s 315,000 and well above the 12-month average of 202,000 — certainly underscores the Federal Open Market Committee’s resolve not to cut The Bank’s FundsRate come the 29 January Policy Statement.And obviously the stock market didn’t like the comparatively “robust” employment news one bit as this “good is bad” Investing Age of Stoopid rolls along.
Again as herein detailed a week ago, the Dollar Index continues to get the bid, trading yesterday to as high as 109.485, such level not seen since 10 November 2022.The Dollar bulls sense the inflation genie is not yet fully back in the bottle to the Fed’s liking, albeit we’ll see this Tuesday/Wednesday that which the Bureau of Labor Statistics has concocted for December:consensus at this writing suggests a slightly cooler inflation read.Should that be the case, then we’d expect Gold to finally end its weekly parabolic Short trend.
And as we turn to Gold’s two-panel graphic of the daily bars from three months ago-to-date on the left and 10-day Market Profile on the right, the picture appears fairly upside constructive for price otherwise still being in a “Short trend”.Note the baby blue dots of trend consistency:they are poised come Monday to climb above the 0% axis meaning the 21-day linear regression trend shall have rotated from negative to positive.Meanwhile, the Profile’s big belly of support starts ’round 2673:
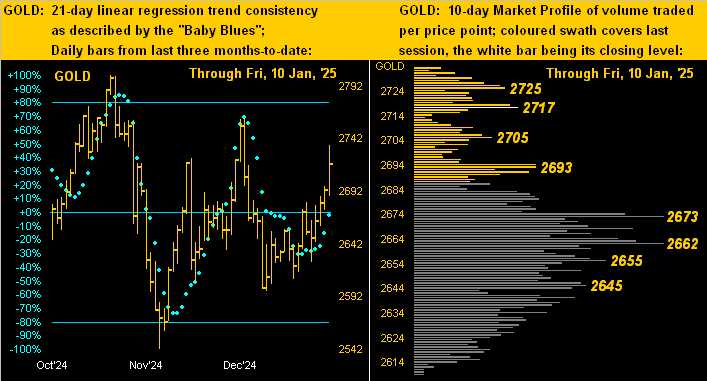
The like graphic for Silver continues to be an almost identical twin to that for Gold. As her “Baby Blues” (at left) work their ascent, that regression trend also looks ready to rotate to positive, whilst the Profile (at right) depicts key underlying supporters at 30.70 and 30.00. Let’s go Sister Silver!
Thus as we wait and see if this ensuing week ends Gold’s Short-side spree, let’s wrap for today with a wee FinMedia folly.
In taking coffee here with a fabulously fine friend (who indeed is a highly-influential member of truthful media), we bemoaned the issue of the modern-day FinMedia becoming essentially less and less useful, at least from our personal perspective.Our friend pointed to AI garnering more control of what is put upon FinMedia website home pages as “news”.And quite obviously “Assembled Inaccuracy” begets same.To wit this headline from Dow Jones Newswires the evening prior to Friday’s release of December’s job data: “Investors on edge as Friday’s jobs report could make or break stock-market rally.”
Query: ” What ‘Rally’ “? Any of you see a “Rally”?At least judging by the S&P 500, such “Rally” faltered five weeks ago (06 December) from which the Index on balance has fallen.Perplexed as can be, we straightaway went to our own “live” on-screen visual of the S&P 500 futures from one month ago-to-date and captured its image as follows, some six hours prior to the release of the jobs data.No “Rally” there by that grey trendline:
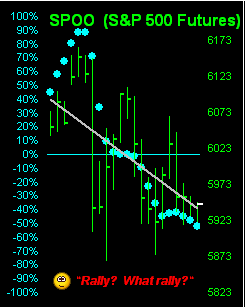
“Well, it depends from how far back you measure, mmb…”
True enough, Squire. But today’s “info flow” seems so short-attention-spanned that to go back a month is ancient history. Of course the S&P increased +23% in 2024, bettered (amongst our BEGOS Markets) only by Gold’s +27% gain.
But to our point, especially with respect to the above example:we oft quip about the modern-day analysts/FinMedia cabal as being math-deficient; now we’re concerned over their becoming work-deficient.As we’ve noted over recent years, were Grandpa Hugh in charge today (as he was back in the day), he’d fire the lot of ’em.
This underscores — especially with respect to today’s investing and trading — the critical importance ofdoing the math and attendant work yourself … else be left on the shelf.We turned off FinTV 20 years ago and are better off for having so done.
It also underscores the importance of staying with Gold … and Silver as bold!
More By This Author:
Our Gold High for 2025
Gold’s Weak Wend Toward Year-End
Gold Seeks Charisma ‘Round Inflation’s Enigma
Disclaimer: If ever a contributor needed a disclaimer, it's me. Indeed, your very presence here has already bound you in the Past, Present and Future to this disclaimer and to your acknowledging ...
more


