Gold Seeks Charisma ‘Round Inflation’s Enigma
(Click on image to enlarge)
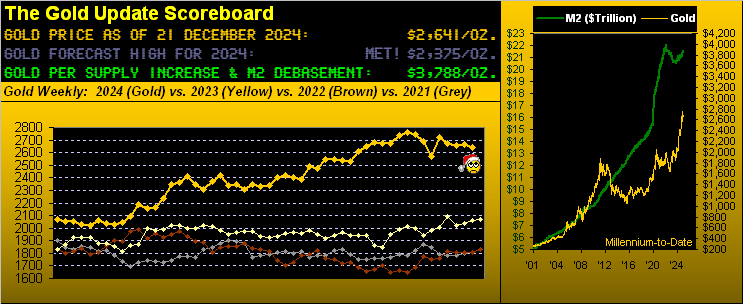
Welcome to winter as we type literally through the soltice here at 10:21 CET. And let’s start with a “Thumbs Up!” to one Elizabeth Morgan Hammack, graduate of THE Leland Stanford Junior University, today President of the Federal Reserve Bank of Cleveland, and who — as a voting member of the Federal Open Market Committee — had the “cojones” to not go in favour of last Wednesday’s -25bps reduction for the FedFundsRate to its new 4.25%-4.50% Target Range.
“So are you taking credit for her having read last week’s Gold Update, mmb?”
Heavens no, dear Squire. Rather, we’re just favourably impressed that — instead of being FinMedia-led as seems is the Fed — Ms. Hammock can do math sufficiently such as to realize inflation has been going the wrong way as precisely depicted in our prior missive. Brava Beth!
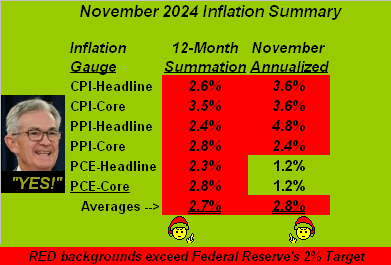
Yet such credit due, suddenly yesterday (Friday) the inflation situation completely whirled ’round down! November’s so-called “Fed-favoured” inflation gauge — the mouthful entitled Personal Consumption Expenditures Prices Index — came in at a wee +0.1% at both the headline and core paces. That materially differs from the Consumer Price Index’s readings of +0.3% (headline and core) and the Producer Price Index’s respective +0.4% and +0.2% readings. ‘Course, whilst both the CPI and PPI are calculated by the U.S. Bureau of Labor Statistics, the PCE is figured by the U.S. Bureau of Economic Analysis. Thus by the BLS gauge, inflation is increasing, whereas by the BEA, inflation is decreasing. Hence our title including “Inflation’s Enigma” as trust in the overall picture is a bit of a stigma. Powell & Co. may be pleased over November’s PCE, but the averages clearly state inflation is higher as in the table we see:
In turn challenged by it all, Gold is doing its darnedest to seek some charisma. Despite price’s rampant volatility, Gold settled the week at 2641, “net net” again being little changed as we’d seen the week prior. Two weeks ago, Gold traced 112 points for a net change of only +11; now this past week, Gold traced 87 points for a net change of only -25. Thus Gold’s net two-week change is but -14 points. Reprise Chris Isaak’s tune from back in ’95: “Goin’ Nowhere“
That warbled, Gold has wobbled on balance a bit lower within the context of its ongoing parabolic Short trend per the weekly bars as next shown from a year ago-to-date. Indeed, this past week’s low — 2597 — was the lowest level traded since 2569 back on 18 November. Further upon this Short parabolic trend’s commencement, you may recall our penned suggestion of “…Gold revisiting the upper 2400s on this run…” given the weekly MACD (moving average convergence divergence) also then having crossed to negative, which since has continued to deteriorate. Rather anti-charismatic, that. To the bars and rightmost red-dotted Short trend, now six weeks in duration:

Yet both Gold and the S&P 500 celebrated yesterday’s release of the benign PCE: intraday low-to-high Gold gained +1.9% and the S&P +2.6% as the increasingly inflationary aspects of the CPI and PPI were swiftly forgotten.
‘Course, the S&P 500 put in one of the wildest week’s points-wise in its 67-year history: Wednesday’s net S&P loss of -178 points ranks fifth worst since the Index’s inception in March 1957; (on a percentage basis, the day’s -2.9% loss ranks 132nd-worst since at least as far back as 1980). Notwithstanding Friday’s PCE-induced rally, Wednesday was a torrid reminder of just how fragile the stock market has become; Moreover, the “live” price/earnings ratio of the S&P 500 settled the week at 46.5x. But until COVID’s “bonus” $7T finds its way to better-returning investments, (i.e. short-term U.S. debt currently yielding more than triple that of the S&P), the Great Game of Chicken continues per this image from the “Marked-to-Market Everyone’s a Millionaire Dept.”

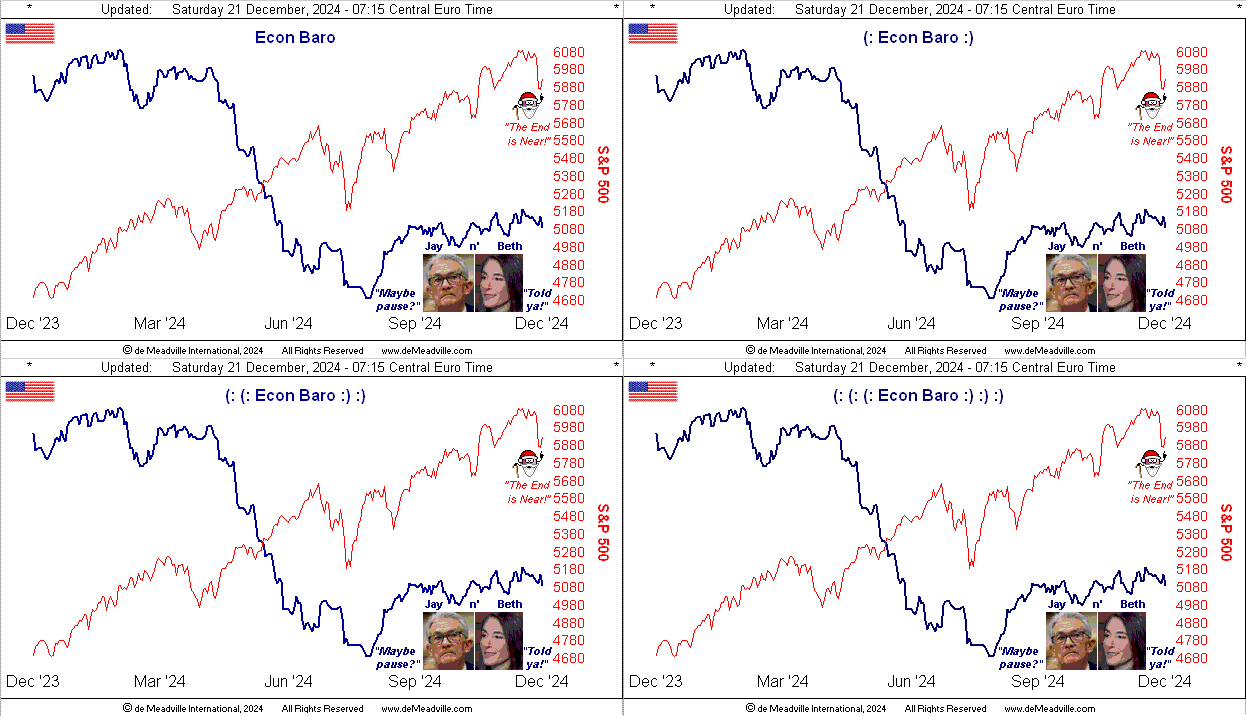
Hardly “chicken” of late has been the Economic Barometer, which (along with the increasing CPI and PPI) does justify the Fed to at least “pause” rate reductions come 29 January’s Policy Statement from the Open Market Committee. And as you regular website readers know, we emphasize the leading characteristics of our analytics. Two of note from this past week were in the daily Prescient Commentary. From Tuesday: “…the S&P … is so overcooked to this point both fundamentally and technically that some degree of downside hoovering awaits; perhaps ’twill be a ‘sell the priced-in’ Fed announcement tomorrow”. Bingo. From Thursday: “…Leading (i.e. ‘lagging’) indicators … are supposed to be mildly negative, but an ‘unch’ or mildly positive read wouldn’t surprise us given the Baro’s recent resilience.” Bingo.
‘Tisn’t magic; rather ’tis merely doing the math. And the Baro’s incoming metrics for November have been sufficiently buoyant for a gain in the Conference Board’s Leading Indicators of +0.3%; but instead, the “expert consensii” were looking for a loss of -0.1%. “How’s that Ivy League education workin’ out for ya?”
In moving to the graphic, of the past week’s 20 incoming metrics, there were notable improvements in Retail Sales, Existing Home Sales and Building Permits. Too, Personal Spending increased, albeit its underlying Income slowed. As well on Friday, December’s Philly Fed Index boffed the Baro a bit, but its overall stance has been fairly firm since Late summer:
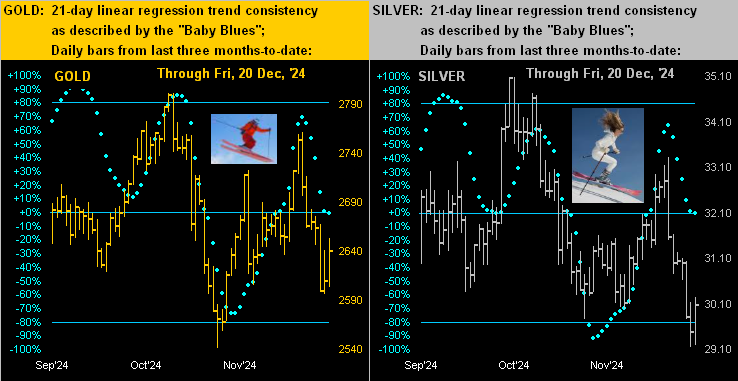
Meanwhile, precious metals’ prices across the past three months have been skiing the bumps as below depicted for Gold on the left with Silver on the right. And as to their respective trend’s consistency, the “Baby Blues” are tracking nearly identically, meaning of course that Sister Silver — rather than adorned in her industrial metal jacket (as when aligned with Cousin Copper) — is instead sporting her white-on-white precious metal pinstripes. Gettin’ some air there, baby!
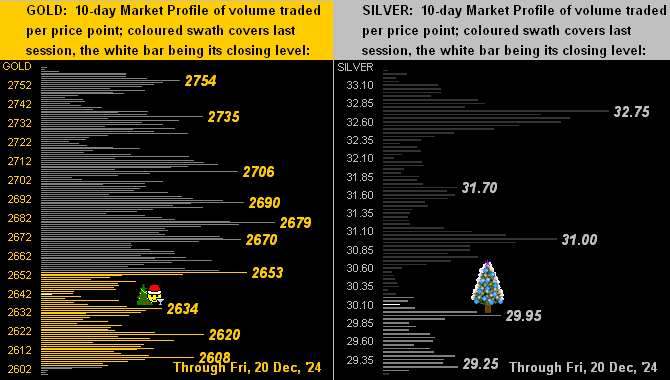
Too, because of their downhill runs, prices at present are quite low within the 10-day Market Profiles for Gold (at left) and for Silver (at right). Notable high volume support and resistance prices are as labeled:
Thus as we glide into winter and the first of two back-to-back abbreviated trading weeks, let’s assess the state of The Stack:
The Gold Stack
Gold’s Value per Dollar Debasement, (from our opening “Scoreboard”): 3788
Gold’s All-Time Intra-Day High: 2802 (30 October 2024)
2024’s High: 2802 (30 October 2024)
Gold’s All-Time Closing High: 2799 (30 October 2024)
The Weekly Parabolic Price to flip Long: 2777
10-Session “volume-weighted” average price magnet: 2681
Trading Resistance: notable nearby Profile nodes 2653 / 2670 / 2679 / 2690
Gold Currently: 2641, (expected daily trading range [“EDTR”]: 44 points)
Trading Support: 2634 / 2620 / 2608
10-Session directional range: down to 2599 (from 2761) = -162 points or -5.9%
The 300-Day Moving Average: 2329 and rising
The 2000’s Triple-Top: 2089 (07 Aug ’20); 2079 (08 Mar’22); 2085 (04 May ’23)
2024’s Low: 1996 (14 February)
The Gateway to 2000: 1900+
The Final Frontier: 1800-1900
The Northern Front: 1800-1750
On Maneuvers: 1750-1579
The Floor: 1579-1466
Le Sous-sol: Sub-1466
The Support Shelf: 1454-1434
Base Camp: 1377
The 1360s Double-Top: 1369 in Apr ’18 preceded by 1362 in Sep ’17
Neverland: The Whiny 1290s
The Box: 1280-1240
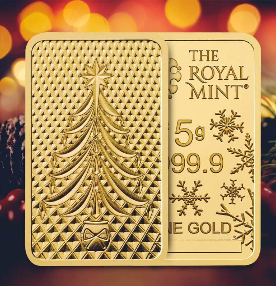
In sum, Gold whilst seeking some charisma at least technically still looks to falter a bit; but fundamentally as the late great Richard Russell would remind us, there’s never a bad time to buy it. This gem to wit, courtesy of The Royal Mint:
More By This Author:
Gold Does The Spike And Sink
Gold Boring; S&P Warning
Gold In 60 Seconds (IV)
Disclaimer: If ever a contributor needed a disclaimer, it's me. Indeed, your very presence here has already bound you in the Past, Present and Future to this disclaimer and to your acknowledging ...
more


