
The S&P 500 is blooming, while gold cannot hide its weakness. Both have an impact on junior miners, but which lead will gold stocks follow?
It’s Fed decision day! Will the rally in stocks continue? Will miners follow stocks higher or gold lower? Charts provide hints.
Let’s start with something that usually happens at this time of the month.
The USD Index tends to reverse its direction.
(Click on image to enlarge)
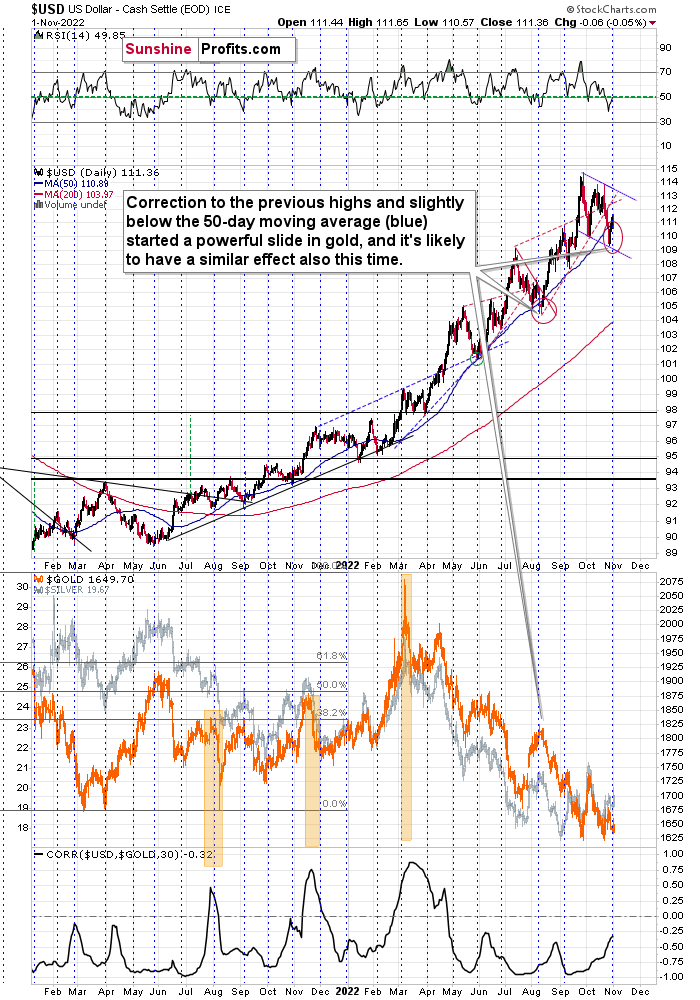
It seems that’s exactly what we saw recently. The USDX dipped below its 50-day moving average, and each time that happened since mid-2021, it meant that a bottom was in or just around the corner.
At the same time, the USDX moved to the lower border of the flag pattern and approximately to the previous (July) high.
This is all bullish, not just per se, but also because we saw something very similar in early August, earlier this year. What happened next? Well, not only did the USD Index rally, but gold fell like a stone in water.
The main difference this time is that gold (the lower part of the above chart) is not after a rally that’s as big as the July rally was. In other words, gold is now weaker, and the situation is now more bearish for gold than it was in early August.
During its most recent run-up, gold wasn’t even able to get back above the $1,700 level. It’s weak, and it’s all really, really bearish.
(Click on image to enlarge)
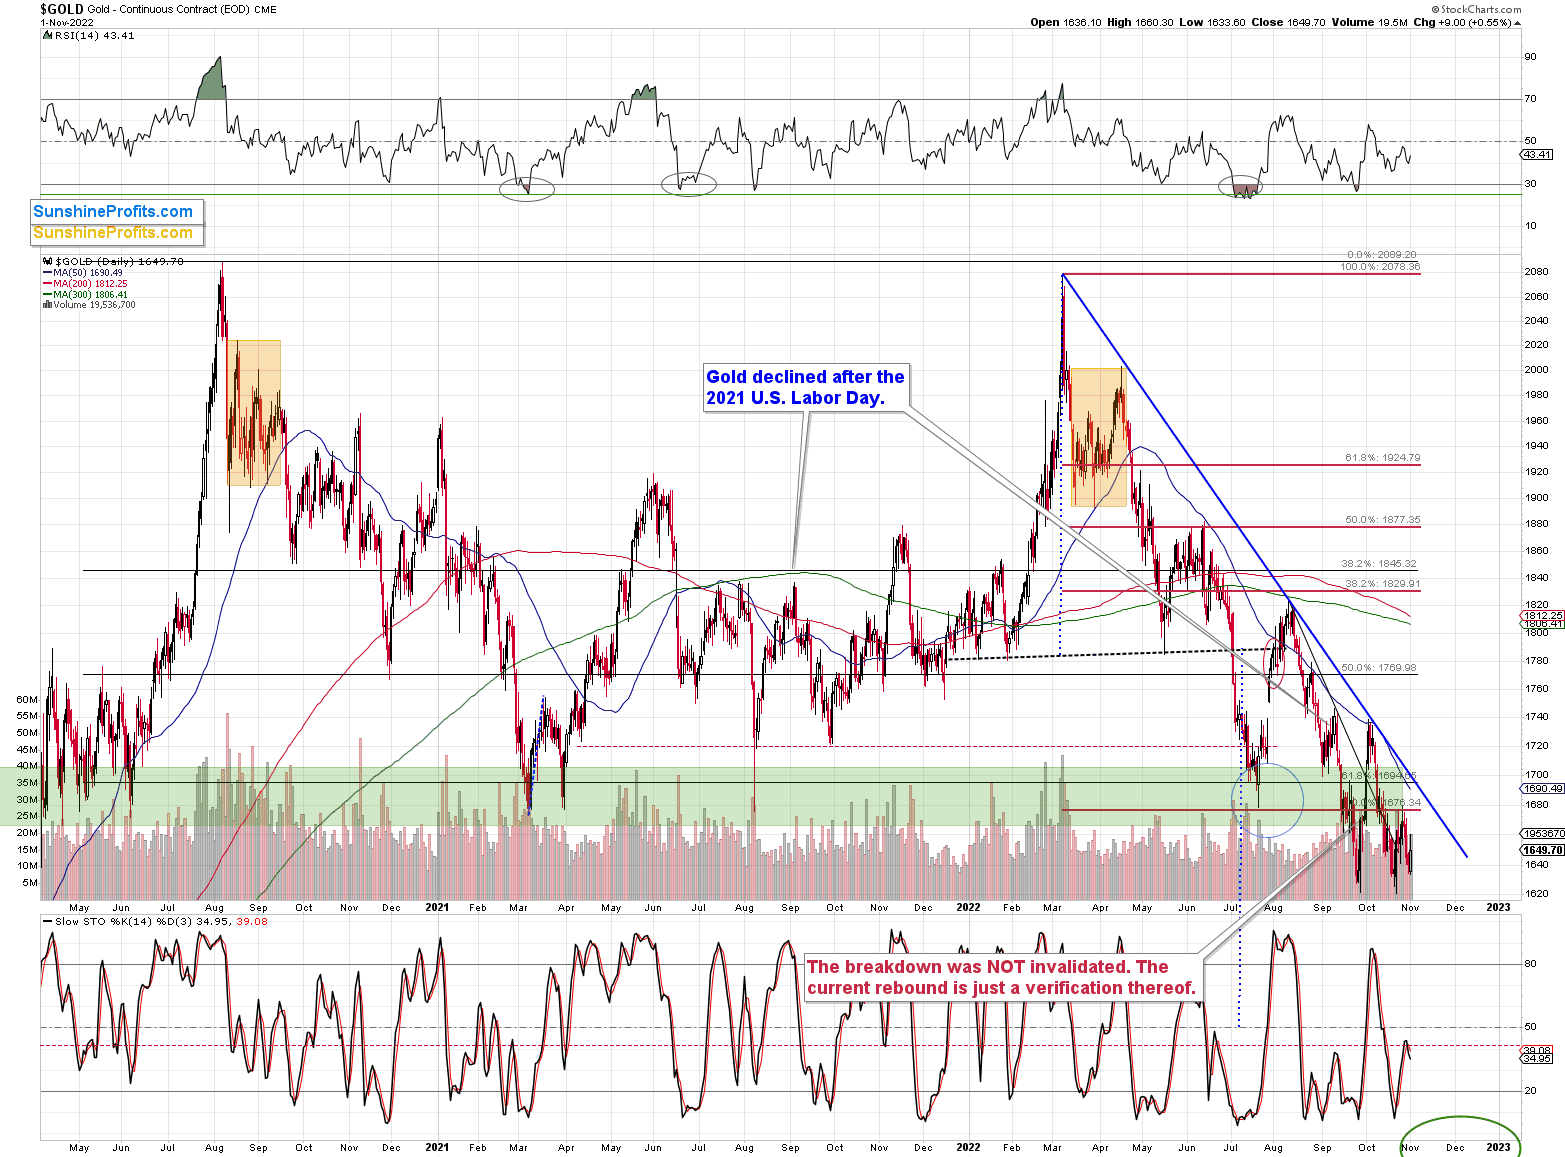
Instead of moving back above $1,700, gold verified its breakdown below this level, and we saw a fresh sell signal from the stochastic indicator. Yes, it’s a bearish combination of factors.
If it wasn’t enough, we just saw a major sell indication from the silver market.
(Click on image to enlarge)
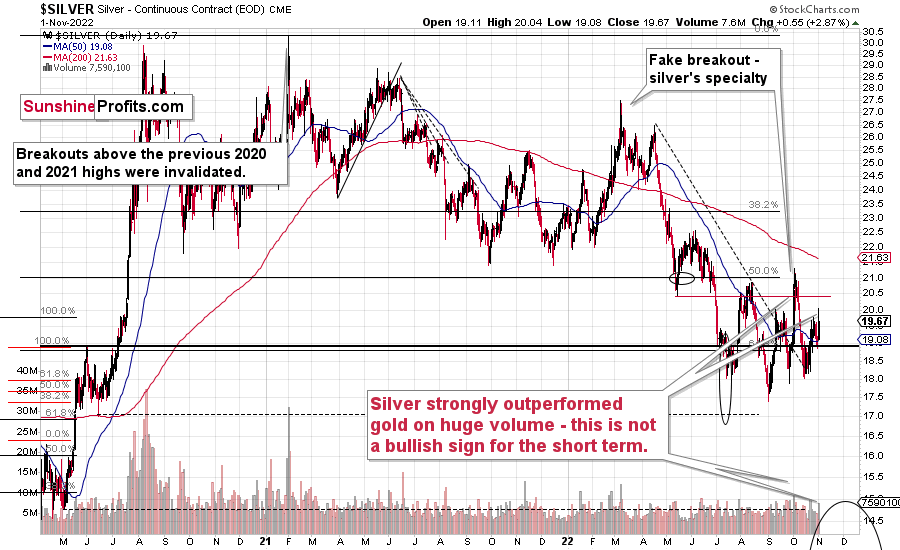
The signal comes from silver’s very short-term outperformance over gold. Whenever something like that happens (especially on strong volume) after a rally, it’s an indication that the rally is either over or about to be over. And yes, yesterday’s rally (and intraday reversal) took place on relatively strong volume.
Remember the fake early-October rally? That was yet another example of this technique in action.
(Click on image to enlarge)
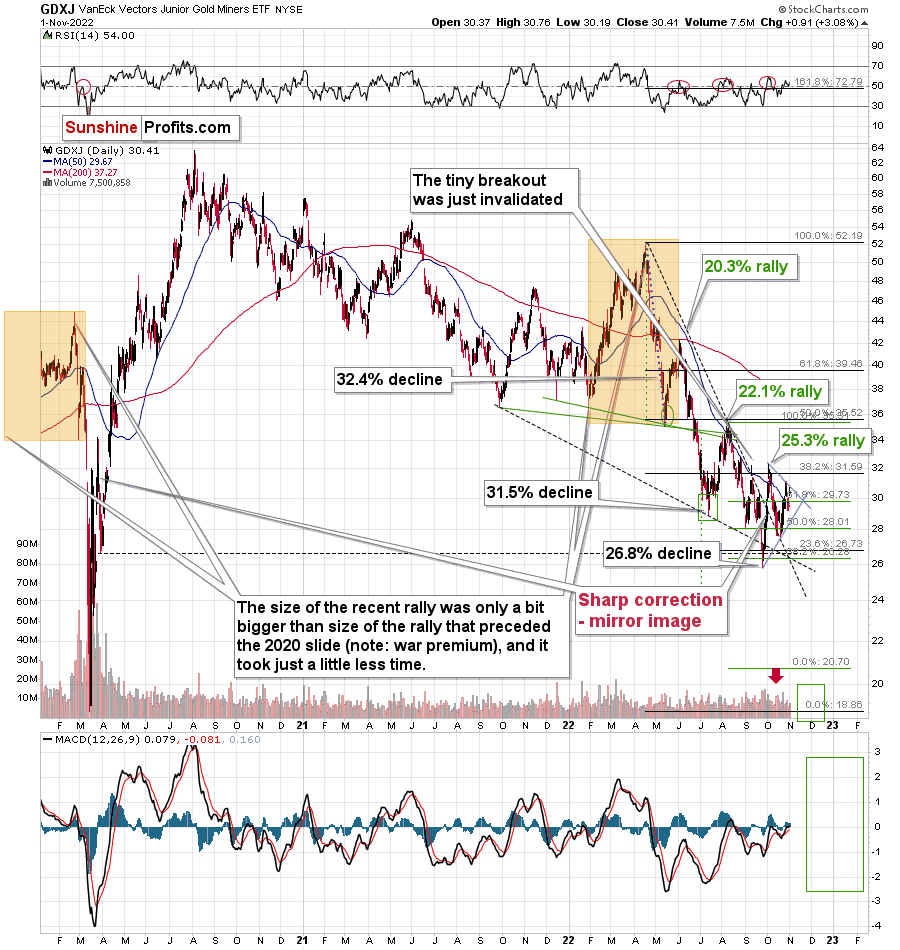
Junior miners moved a bit higher yesterday, but our short positions in them remain profitable nonetheless (and we keep the 100% profitability in the 2022 trades, at least as long as one uses the GDXJ).
Interestingly, the most recent short-term upswing materialized practically right at the vertex of the triangle, based on the two black, dashed support/resistance lines. The vertexes tend to mark reversals, and the most recent move was to the upside, which means that the implications are bearish here.
And now for the part that I get the most questions about – the stock market.
(Click on image to enlarge)
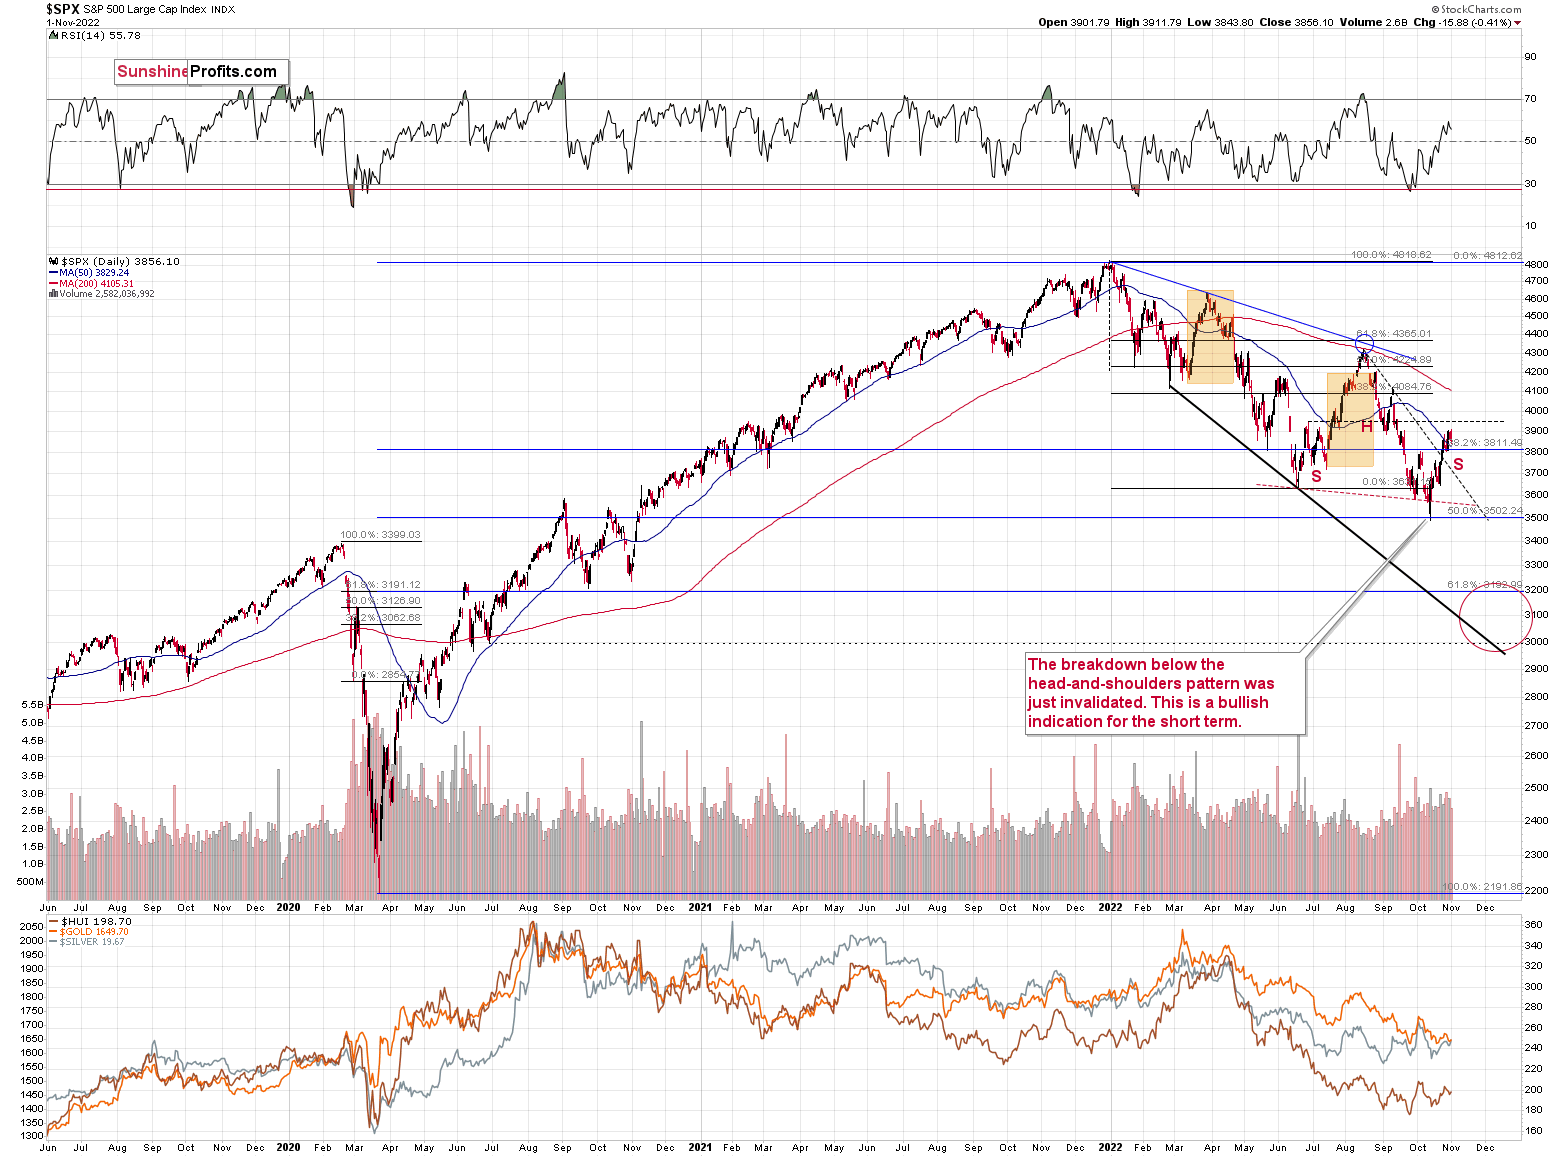
The S&P 500 recently rallied to new monthly highs, which caught investors’ eyes. However, as the index didn’t move above its June 2022 high, the head and shoulders formation could still be completed.
In the case of the S&P 500 index, there is a visible breakout above the declining dashed resistance line based on the August and September 2022 highs.
However, once we zoom in and focus on S&P 500 index futures, it becomes clear that the situation is much more bearish than it seems at first glance.
(Click on image to enlarge)
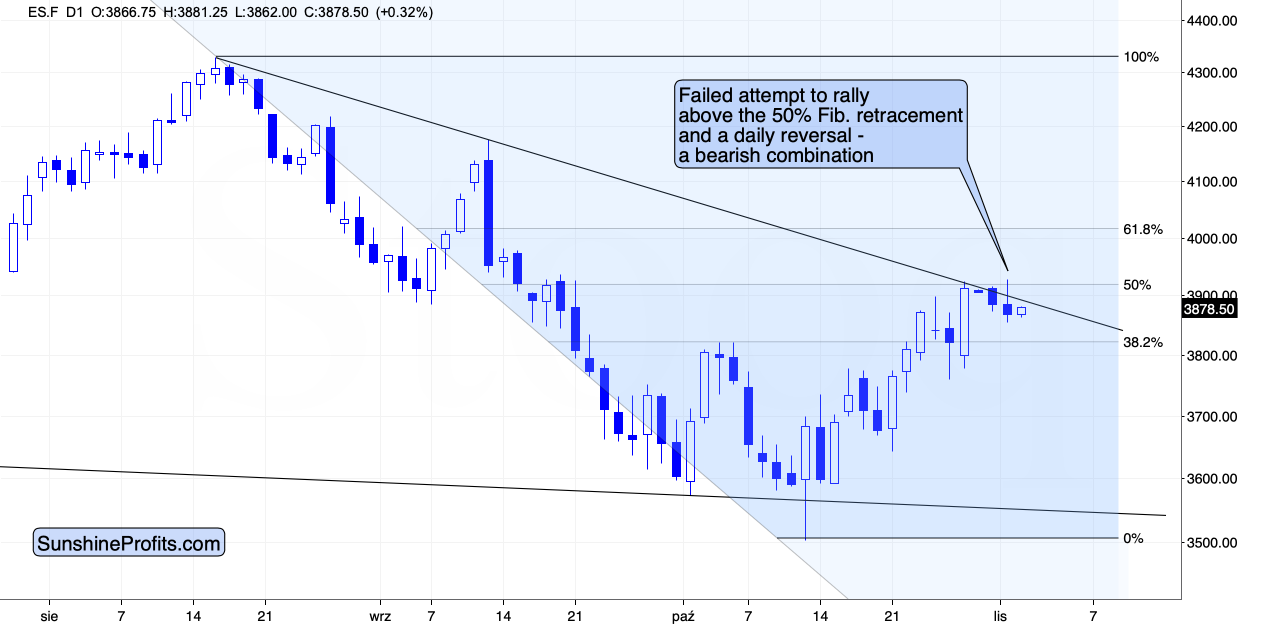
The index futures have longer trading hours than the index, so the above chart includes a broader data range. In many cases, the U.S. session would be key and overnight trading wouldn’t be that important, but in the case of the S&P 500 index futures, those trades are important as this extremely popular index/futures is being traded all over the world, and the sizes of those transactions are not minor.
In other words, paying attention to the S&P 500 index futures is a good idea.
The above chart shows that we just saw a failed attempt to break above the declining resistance line, the October highs, and the 50% Fibonacci retracement based on the August-October decline. This is a powerfully bearish combination.
On top of that, yesterday’s session took the form of a daily reversal.
And yes, this is all bearish news for the stock market.
This, in turn, means that the positive impact that the stock market had on the prices of mining stocks is likely to be reversed. This, plus the bearish implications of gold and silver charts, tells us that the very bearish outlook for mining stocks (especially junior mining stocks) remains up-to-date – at least for the next few weeks-months. In my view, they are likely to rally in the very long run, but not without a bigger decline first.
More By This Author:
Not All Markets Share The S&P 500’s EnthusiasmRelatively Dovish Bank Of Canada Depressed The Dollar
Will Gold Stocks Manage To Ignore The S&P 500’s Volatility?


Comments
Log in or sign up to join the conversation.