
Nvidia Is Just A Gust Of Wind, The Autumn Storm Is Likely Not Over Yet
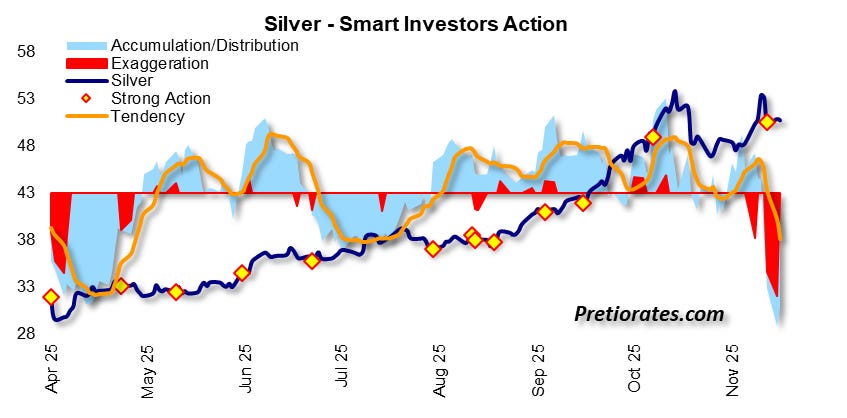
Last week, we talked about precious metals once again – rightly so, in our opinion. But now the topic of stock markets is coming to the fore again. However, we don’t want to deprive you of one of the most striking chart we have analyzed in the last 48 hours: Silver has not shown such a marked “exaggeration” in 14 years as it is currently doing. This “exaggeration,” visualized as a red area in the chart, represents massively exaggerated selling pressure – which historically has almost always been followed by a strong counter-movement. This is especially true when the exaggeration is accompanied by so-called “strong action,” represented by a yellow dot. And yes, this is already evident in today’s market...
With regard to the stock market, we would like to remind our new readers of our thoughts from November 6, 2025: “There is no need to toss the coin.” At that time, we pointed out that although the signals were wildly mixed, we still considered consolidation or even a correction to be likely.
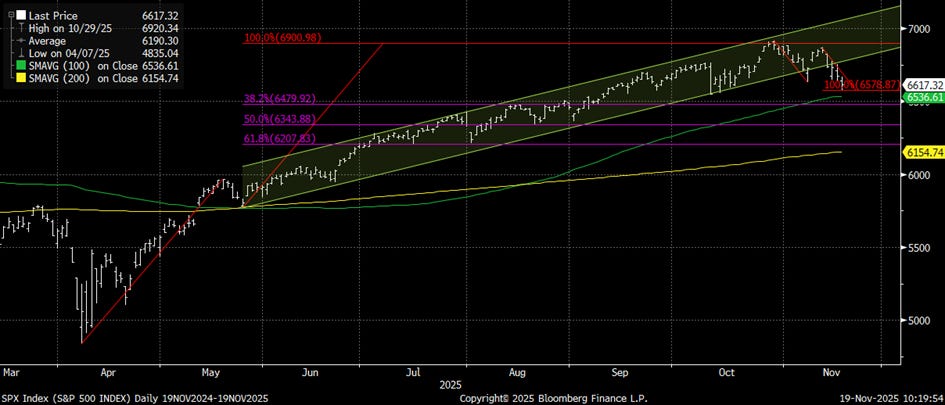
The upside target of 6900 points in the S&P 500 from that issue has been confirmed so far. And in the meantime, the index has fallen out of the trend channel that had been in place since May 2025 and is shown in green on the chart. The same three-wave principle that accompanied the long upward trend now shows in the current downward trend that an initial downside target has already been reached. The question remains: Is the storm already over? Or, after a possible recovery, must we continue to expect rain, storms, or even a hurricane? Today’s quarterly figures from Nvidia provide a small preview—but are still far from the final decision...
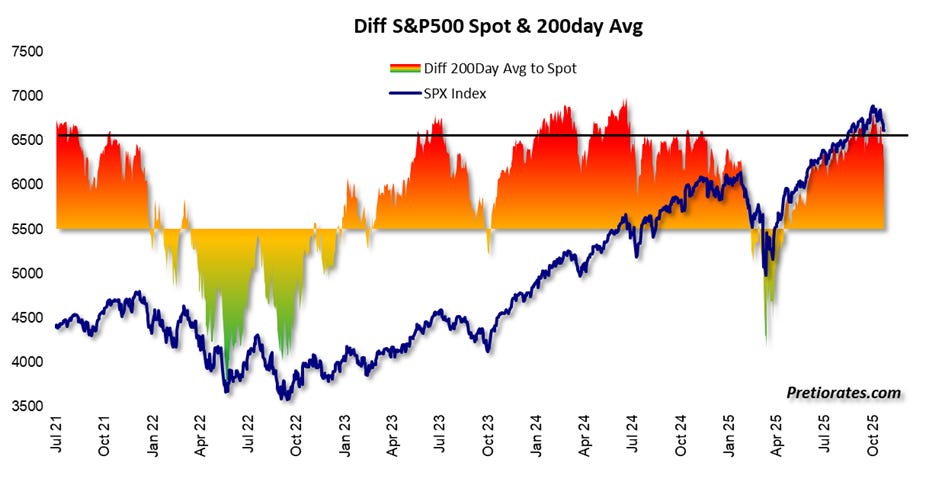
However, we do have a signal that points to several weeks of consolidation: whenever the gap between the 200-day line and the current S&P 500 level becomes too large and exceeds the black line, investments should be scaled back in the medium term.
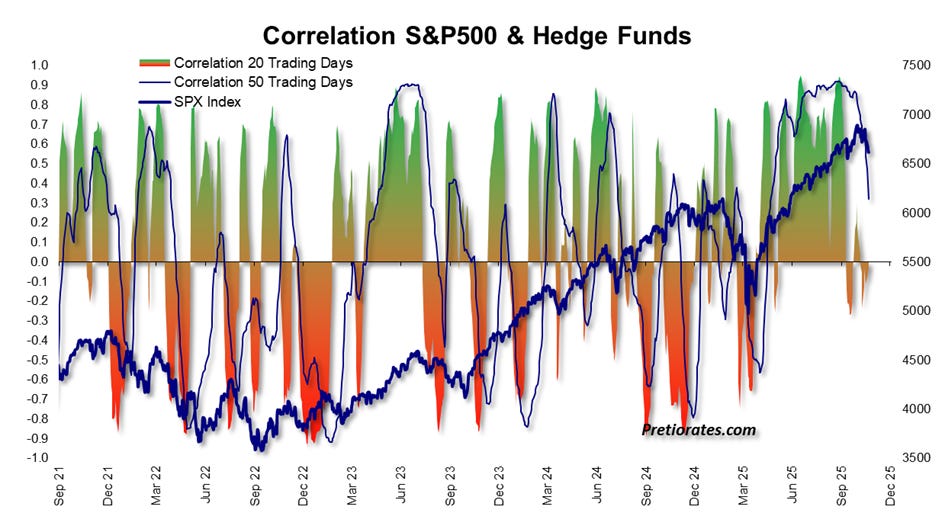
The big hedge funds have already done this. Until October, they maintained a rarely sustained overweight position relative to the market. Recently, however, this position has been reduced to market level – a clear sign of growing caution.
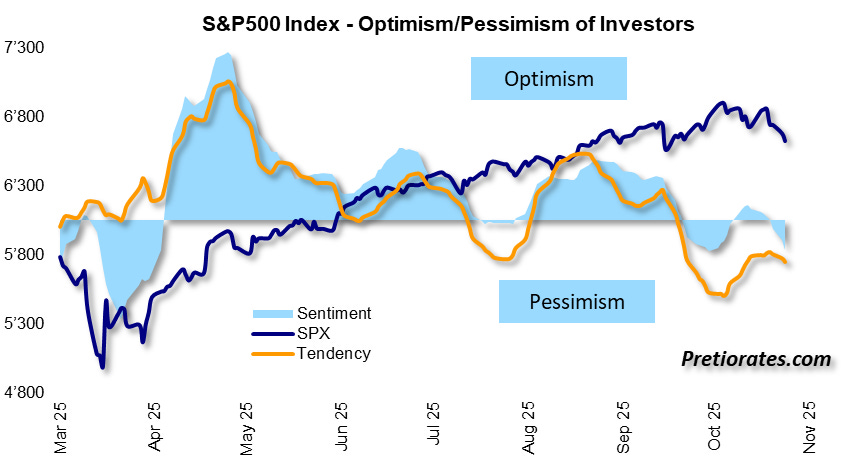
In fact, optimism has cooled noticeably over the past month. And let’s remember: corrections almost never occur during optimistic times – except in the rare case of black swan events. But the S&P 500 has now entered pessimistic territory...
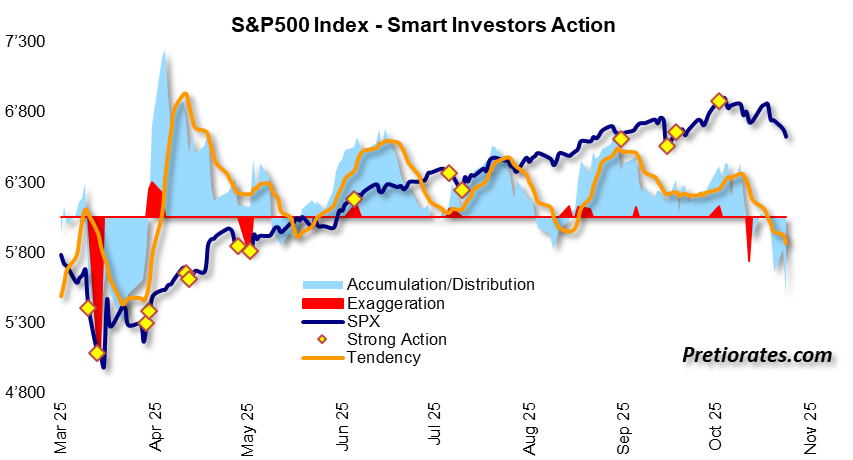
The Smart Investor Action – visible as a light blue area – indicates whether smart investors are accumulating or distributing in the background. Since mid-October, we can clearly see that smart investors are quietly retreating. There is no sign of exaggeration, as there is no red exaggeration area.
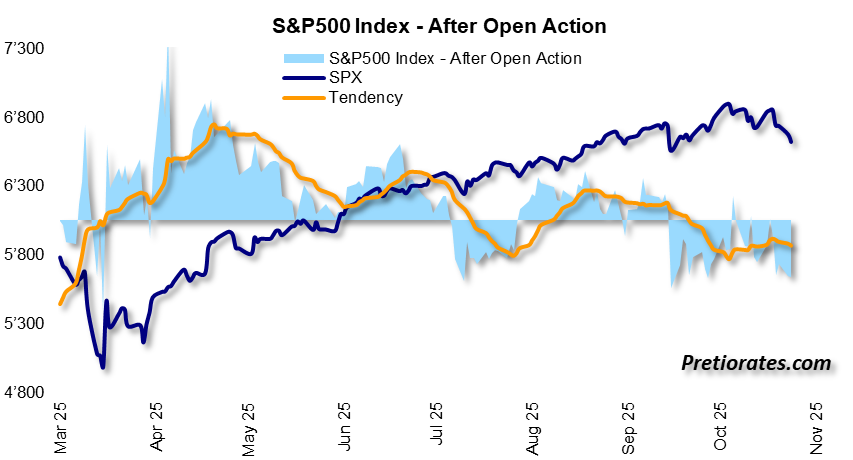
Short-term traders, as measured by after-open action, have been jumping ship since September...
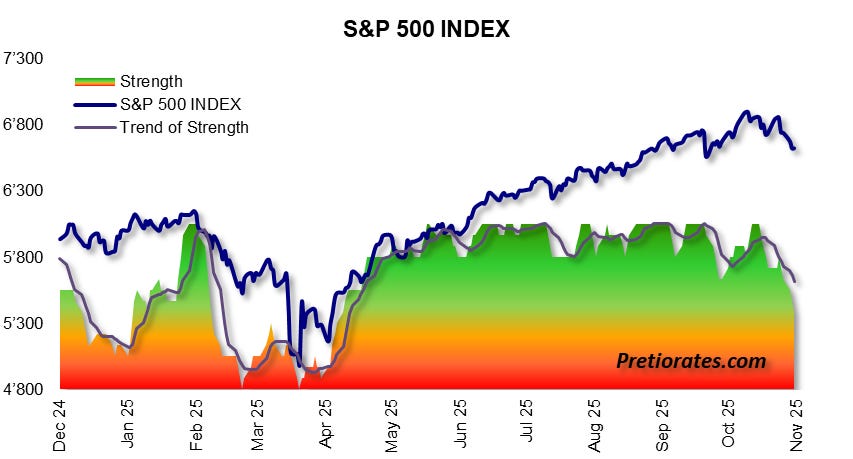
And the long-term strength index may also be heading for the yellow zone soon – a warning signal that the “green light” for investors on Wall Street is at least temporarily going out...
Whether our world is shaped by cycles is a topic that could be debated for days or even longer. We are convinced that it is. But cycles change sometimes; nothing is set in stone. However, the current combination has been working reliably for many years – or decades – if you only look at the major movements. And the cycles of the VIX volatility index are once again pointing to a stronger upturn. More volatility always means more nervousness – and thus usually a correction. However, the current cycle only runs until December 2025...
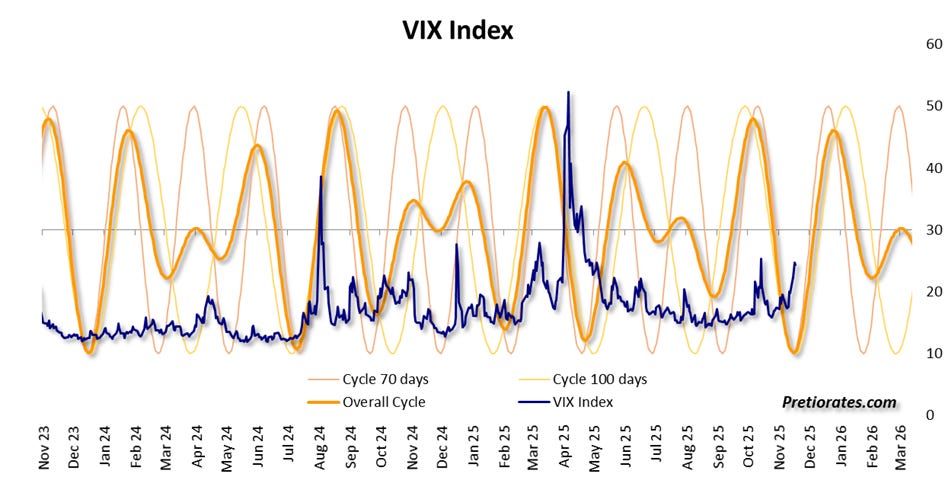
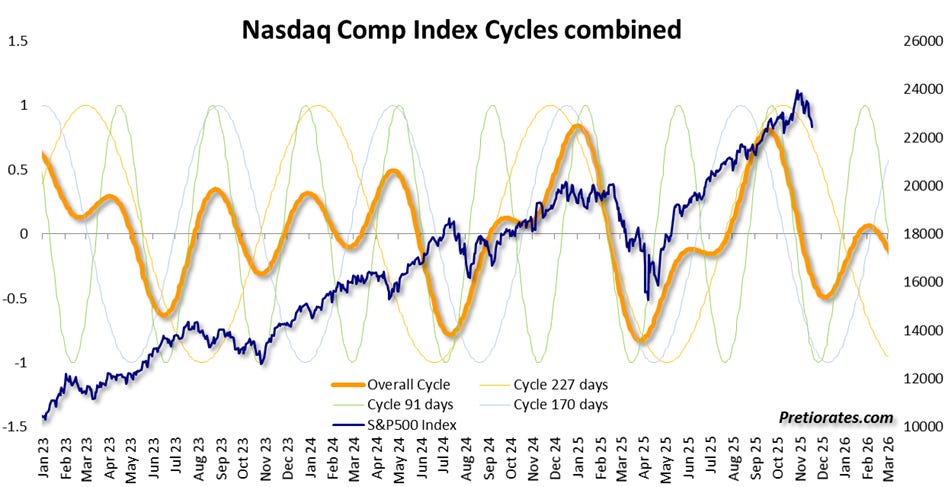
Logic tells us that what applies to the VIX should also apply to the S&P 500 or the Nasdaq. We don’t have a crystal ball or absolute truth – the hit rate is sufficient for a realistic view. And for several days now, a clearer cycle movement has indeed been evident, pointing to a downturn lasting into December.
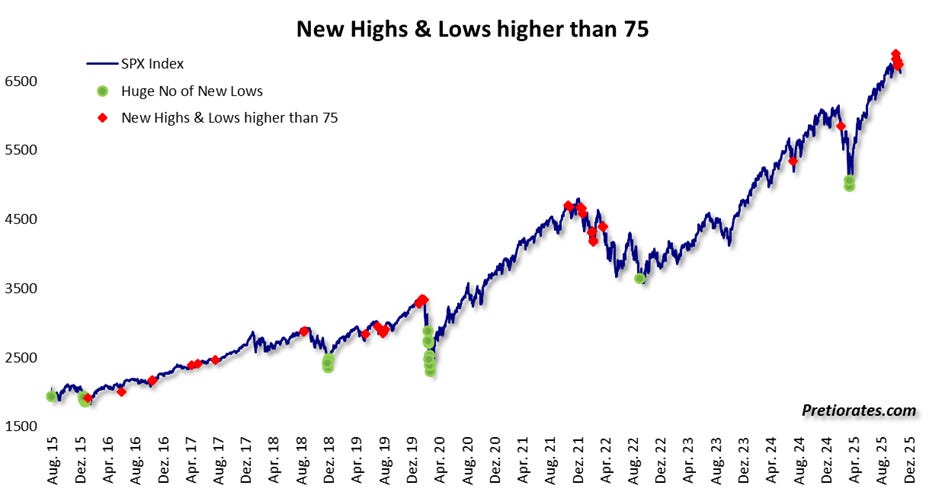
The next chart also provides useful information – not perfect, but valuable in the context of other indicators: when a large number of stocks reach new annual highs, but at the same time just as many stocks reach new annual lows, the overall market appears less convincing. The opposite – the green dots – often indicates hidden strength during periods of weakness. Recently, however, we have seen significantly more red dots.
Bottom line: Today is AI day again. The queen of all AI stocks, Nvidia, is presenting its quarterly figures after the closing of Wall Street – and the market is buzzing with excitement. We have emphasized this several times in recent weeks: Yes, many AI stocks are currently expensive. Yes, a correction could therefore be imminent. But AI itself is NOT a bubble. Twenty-five to thirty years ago, it was euphoric investors who catapulted internet stocks to absurd heights. Today, on the other hand, it is companies that really understand AI – and they are investing huge sums of money. That is why we are convinced that AI, at least in conjunction with quantum computers, will kick off something huge. But we’ll talk about that in another issue...
So Nvidia will lead the way for the next few days, because market participants and the media have been so hyped up about the bubble narrative. But regardless of whether today’s figures are impressive or disappointing, the signals we have presented today indicate that the current consolidation or correction is likely to continue until December 2025.
We wish you successful investments!
More By This Author:
Silver, Enjoy The Ride
There Is No Need To Toss The Coin
Cheap Gold Mines And A New Chapter In The Silver Market
Disclaimer: The information & opinions published by Pretiorates.com or "Pretiorates Thoughts" are for information purposes only and do not constitute investment advice. They are solely ...
more

