
There Is No Need To Toss The Coin

Image Source: Pexels
The older generation of investors view the month of October, which has just ended, with respect. This is not surprising – with age comes experience, and they know that major stock market crashes did not always occur in October, but they did occur with striking frequency. Why this month in particular? Psychologists and philosophers may argue about that. The fact is: this time, disaster did not strike. On the contrary – despite numerous prophecies of doom predicting another slump, the big correction did not happen, even in the hotly debated AI sector.
Nevertheless, we have pointed out in several “Thoughts” over the past few weeks that a consolidation or even a correction could be overdue. The stock markets have reached levels that make even seasoned investors nervous. So it’s time to take a fresh look at Wall Street:
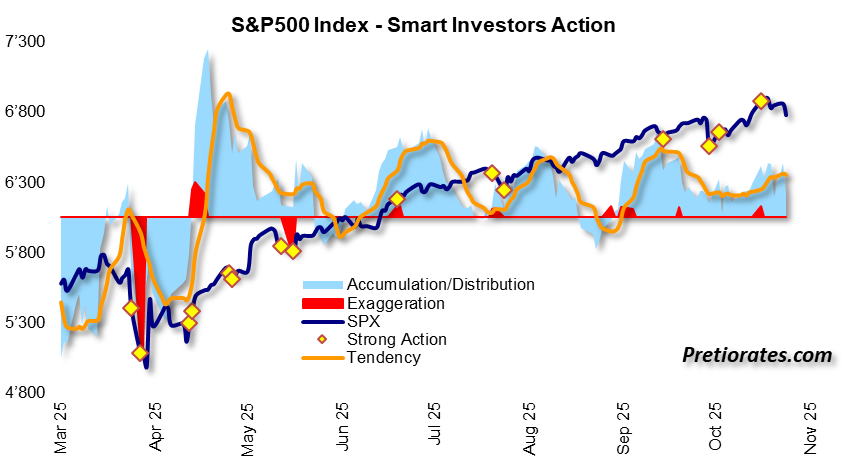
Smart investors operate in the background – their traces are not directly visible in the index. The light blue area in the chart shows whether they are accumulating or distributing, while the orange line shows the trend. Since spring of this year, the “smart” investors have been steadily accumulating.
(Click on image to enlarge)
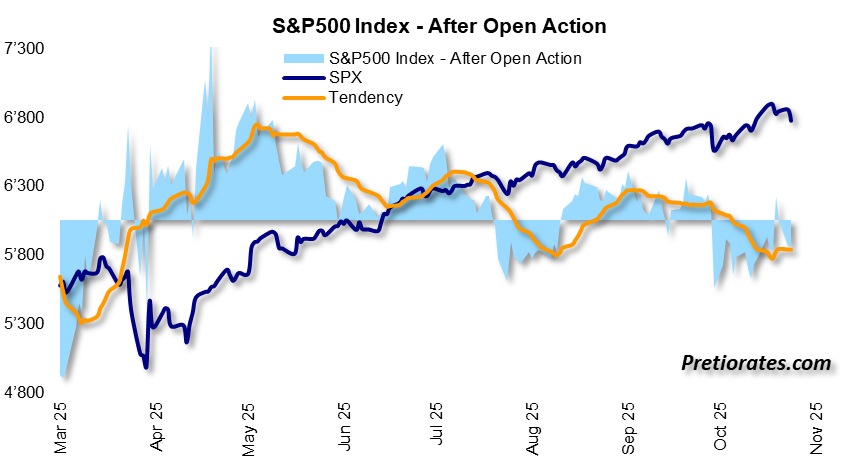
The “After Open Action” chart shows how short-term traders and speculators are behaving. The light blue area slipped into negative territory in October – a clear sign that positions were being reduced or sold.
(Click on image to enlarge)
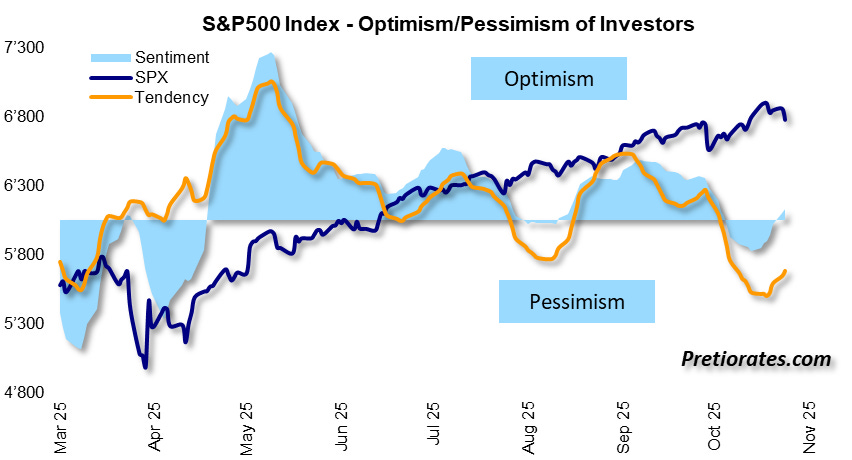
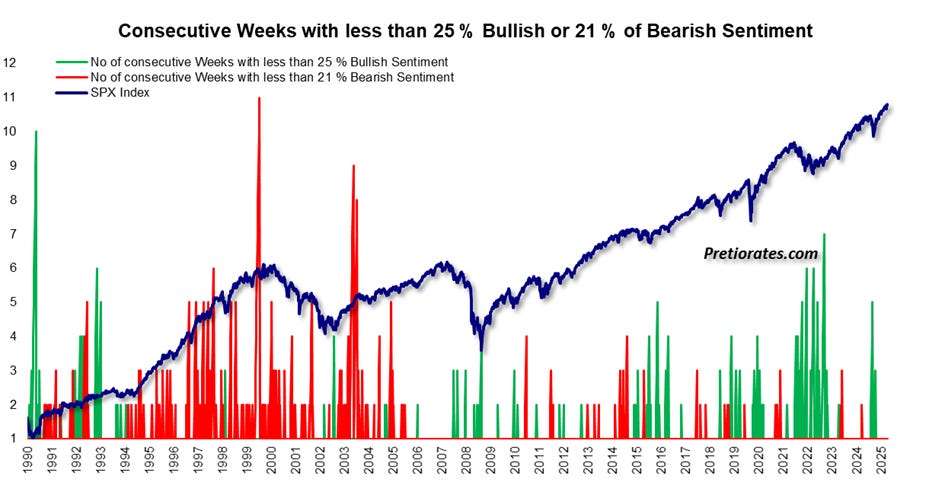
Corrections very rarely occur during periods of optimism. Bad news is simply ignored – except in the case of surprising “black swan” events that no one can predict. After a long period of spring optimism, market sentiment briefly fell into pessimistic territory in October. It is currently neutral or slightly improved.
(Click on image to enlarge)
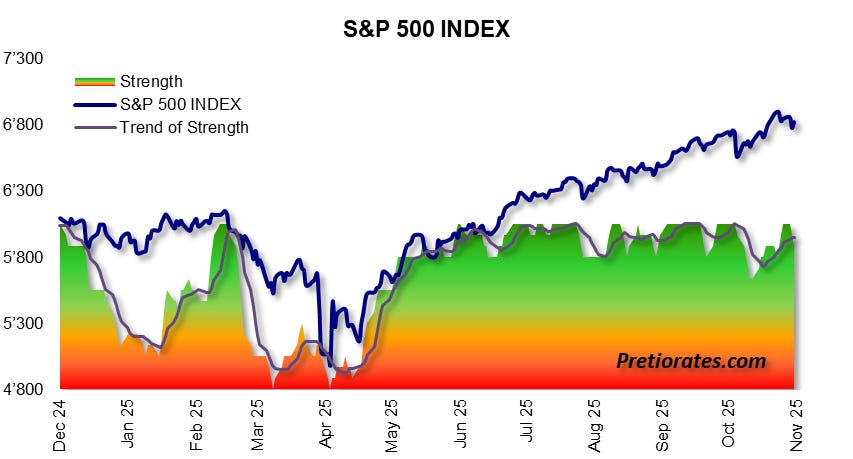
Several indicators reflect the strength of the markets from a medium- and long-term perspective. If the strength index leaves the green zone, caution is advised when investing in stocks. However, the current trend shows that this is not yet the case.
(Click on image to enlarge)
Margin debts – i.e., stock purchases on credit – have risen sharply and exceeded USD 1 trillion for the first time in the US. This is raising warnings of excesses. The figure is impressive, but the absolute number does not mean anything. The volume of credit naturally grows with market capitalization and GDP. It becomes interesting when the “rate of change,” the current percentage change over 15 months, fluctuates sharply. This is not currently the case – which is why our chart does not show any real cause for alarm.
(Click on image to enlarge)
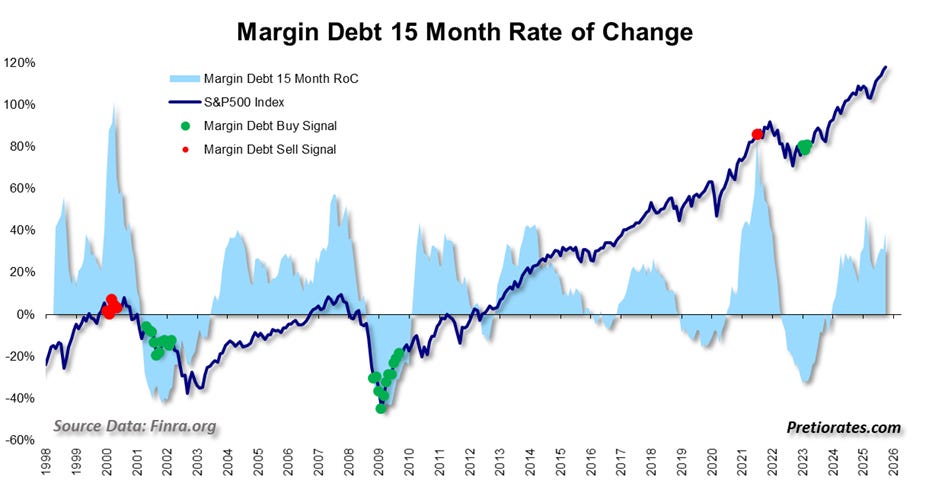
On the contrary: most investors are currently acting so cautiously that this is almost a bullish signal – marked in green on the chart. Those who have already sold cannot generate any further selling pressure, but have liquidity available to re-enter the market when sentiment improves.
(Click on image to enlarge)
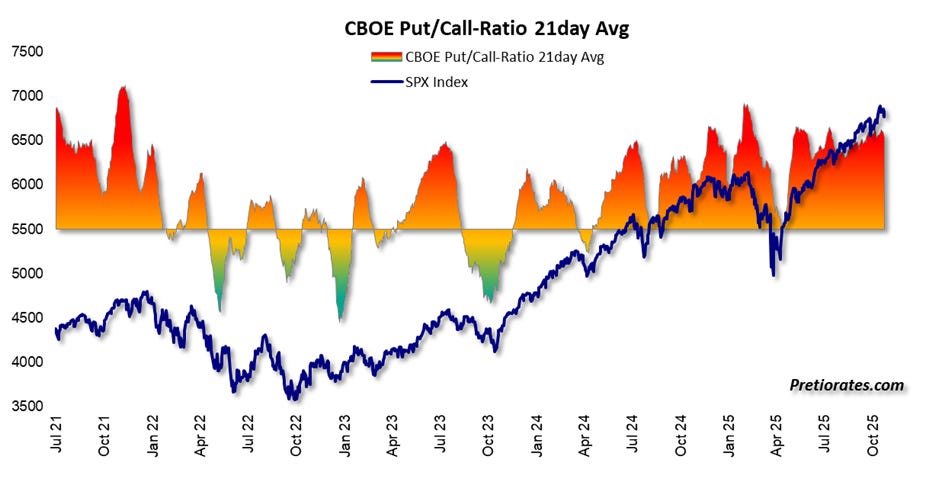
The bears point to the high call/put ratio: too much optimism, too many calls – usually a precursor to corrections. True, but a high ratio can persist for a surprisingly long time and is therefore not a reliable timing tool in every situation.
(Click on image to enlarge)
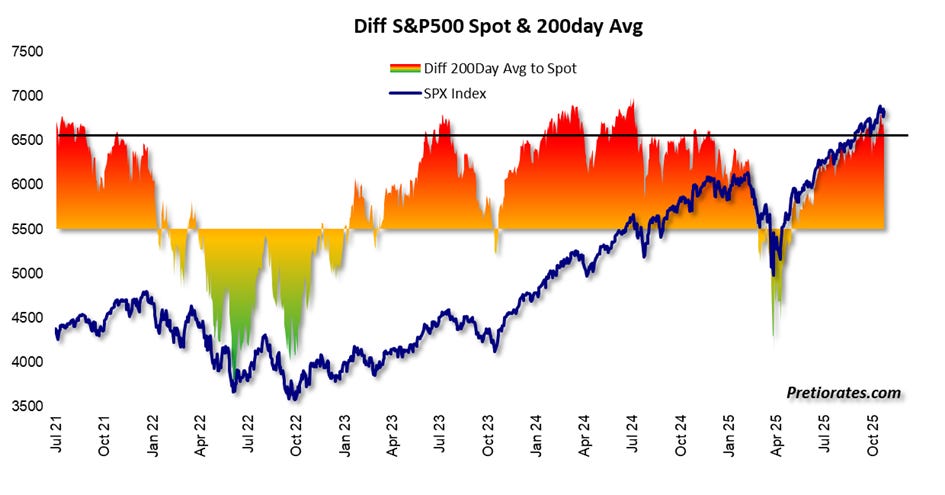
On the other hand, the difference between the S&P 500 level and its 200-day line has reached a level that has often triggered corrections in the past. Profit-taking is therefore entirely legitimate.
(Click on image to enlarge)
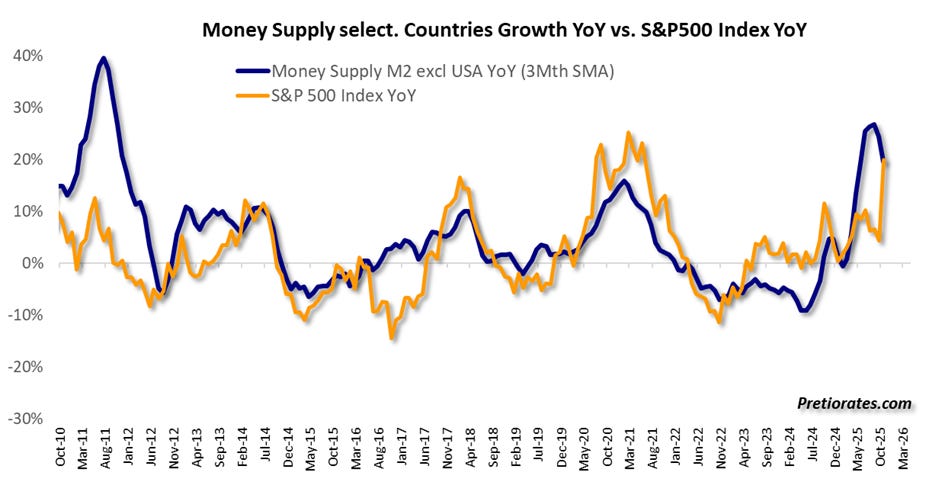
In the long term, another factor is clouding the picture: the recent slowdown in money supply growth by the major central banks – with the exception of the Fed. Stock markets perform particularly well when fresh money flows into the system from central banks. If central banks withdraw liquidity, this will sooner or later also affect the stock markets. The correlation between money supply and the 12-month rate of change of the S&P 500 is strikingly strong. The fact that the money supply is now falling again does not bode well for equity investors in the long term.
(Click on image to enlarge)
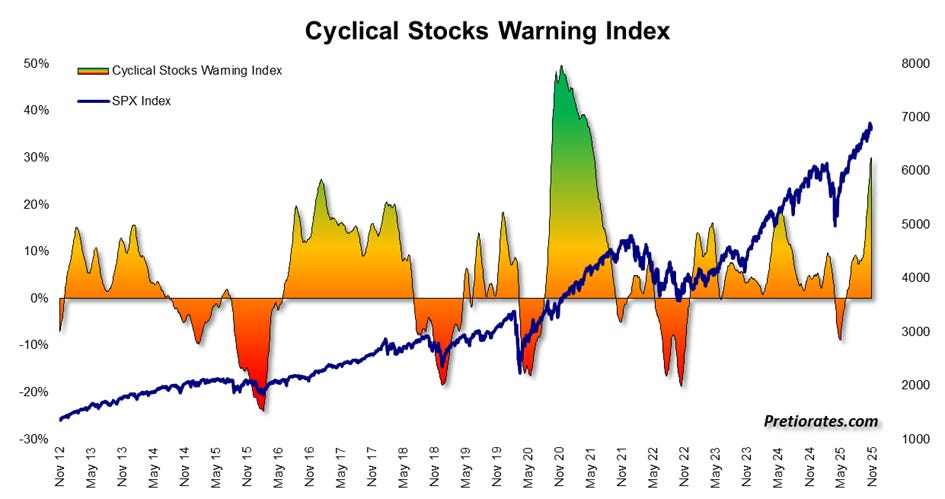
On the positive side, however, equities of cyclical companies are currently sending strikingly bullish signals – a small surprise that does not fit in with the general market picture. We last saw such a clear signal of strength during the deepest phase of the pandemic crisis.
(Click on image to enlarge)
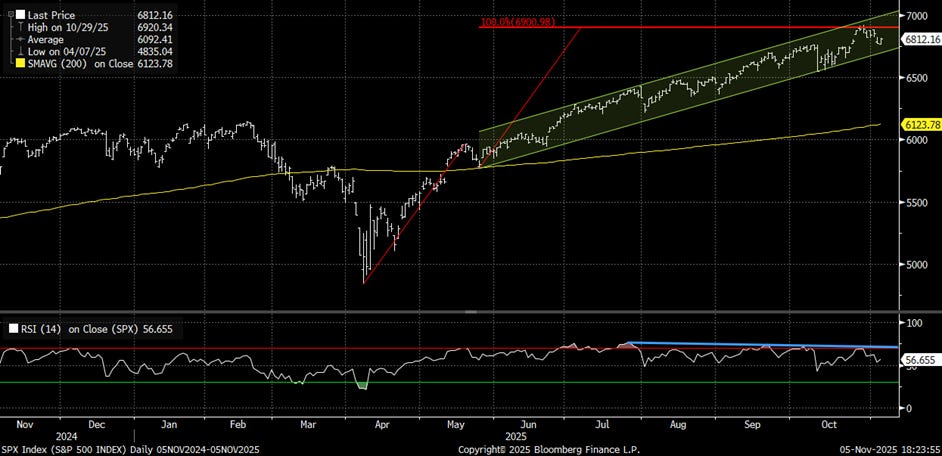
In addition to our own indicators, we also use classic analysis tools. They show that since “Liberation Day” in April 2025, the S&P 500 has reached a key target – two upward waves, interrupted by a correction in May. The third wave is now moving close to the 100% extension target at 6,901 points. However, the new highs have not been confirmed by the Relative Strength Index (RSI) – a warning signal highlighted by the blue line. It is a sign of waning strength.
We are therefore at a crossroads: a break above 6,901 points opens up further upside potential – a break in the green trend channel, on the other hand, could trigger a sharp, rapid correction.
(Click on image to enlarge)
Bottom line: Rarely have the indicators and charts been so contradictory. However, in absolute terms, the markets are trading at high levels, but relative to economic performance, they are less exaggerated. AND: More and more institutional investors are selling off their bonds due to government debt – in favor of corporate bonds and equities. Fears of over-indebted countries suddenly cast high stock valuations in a completely different light. This new type of demand for stocks is an argument that should not be overlooked and may become more significant in the not too distant future. Therefore, if there is a correction instead of a direct breakout, it could be a good buying opportunity.
More By This Author:
Cheap Gold Mines And A New Chapter In The Silver MarketDon’t Be Emotional With Emotional Assets
The Quiet Stories In The Base Metals Complex
Disclaimer: The information & opinions published by Pretiorates.com or "Pretiorates Thoughts" are for information purposes only and do not constitute investment advice. They are solely ...
more

