
Monthly Market Review: Is This A Bubble?

Image Source: Pexels
Are US markets, once again, in a bubble? Are AI stocks overvalued or are they discounting a new age of prosperity driven by big gains in productivity? What about gold? It’s up over 50% this year, signaling…what exactly? Gold is a fear asset that usually shines when the economy is bad and stocks aren’t doing so well. So, why is it up this year? And will it keep going? What about silver and platinum and palladium? Are they rising for fundamental reasons (gold doesn’t have any fundamentals to speak of) or are they, along with gold, caught up in some speculative frenzy?
We can’t know the answers to these questions in real time. AI could be the productivity game changer its biggest promoters believe or we could be building data centers that will never be used to full capacity. Right now, there is no way to know. Gold could be signaling the collapse of the dollar or that bitcoin speculators have decided to diversify or that China is going to a gold standard or that my wife just got back from the jewelry store. Silver….okay I have no idea why silver is rising. Platinum and palladium do have fundamental support but with prices up so much is that already discounted? I obviously don’t think so since I still own them both but I don’t know that for sure. I think it was Alan Greenspan who said that you can only recognize a bubble in retrospect. That is true because whatever narrative is driving the buying could turn out to be true, in which case we would look back and call it a bull market. So which is this? Call me in a few years and I’ll let you know.
You can certainly look at valuations and say the S&P 500 is expensive but you can also point to earnings growth that may justify the high multiple – if it continues. You can point to the concentration of the index and say that the rally is built on just a few stocks but you can also find times in the past when the index was nearly as concentrated and wasn’t in a bubble. The top 10 holdings in the S&P 500 in 1960 represented 36% of the index vs 40% today. The biggest weighting was AT&T at 6.9%; today it is Nvidia at 8.5%. AT&T was still in the top 10 of the S&P 500 in 1999; will Nvidia have as good a run? I’d say that is highly doubtful since AT&T at the time was a monopoly and Nvidia is already seeing some pretty stiff competition but, again, I can’t say that for sure. Intel entered the top 10 of the S&P in 1995 and was still there in 2005. That’s a hell of a run for a company in a cyclical, highly competitive business but nothing lasts forever. Today, even after its recent rally, Intel is ranked 57th by market cap and AT&T is 62nd.
There is no sure fire way to know if you should be buying an asset that has already risen a lot. I do think that your sense of urgency is a pretty good contrary indicator. If you feel like you absolutely, positively need to buy some asset today, you might want to just hold off a bit and see if prices come back down. And I don’t mean you have to wait until it crashes because it may not, but we all know that prices that have been rising rapidly won’t continue to do so indefinitely. Someone once said that a bubble is when your stupid brother-in-law is getting rich and you aren’t; FOMO is a powerful thing.
Technical analysis is usually used by short term traders but it can be useful for long term investors too. I track the 50 month moving average of the S&P 500 and where the index is in relation to it. Over the long term the 50 month MA has acted as an anchor for the index. In bull markets it will act as support and in bear markets resistance. Get too far above or below and the index will correct. How much above and below? I use 2 standard deviations as a caution flag but in a bull market – and this is definitely a bull market – the index can trade at that level for extended periods. But if you approach 3 standard deviations above the average you should probably start looking for an exit of some kind. This is how the current bull market looks. The blue line is the 50 month moving average; the red lines are 3 standard deviations above and below the average. The index is currently between 2 (6645.54) and 3 (7506.38) standard deviations above the average. That puts us, in my opinion, well into cautious territory.
(Click on image to enlarge)
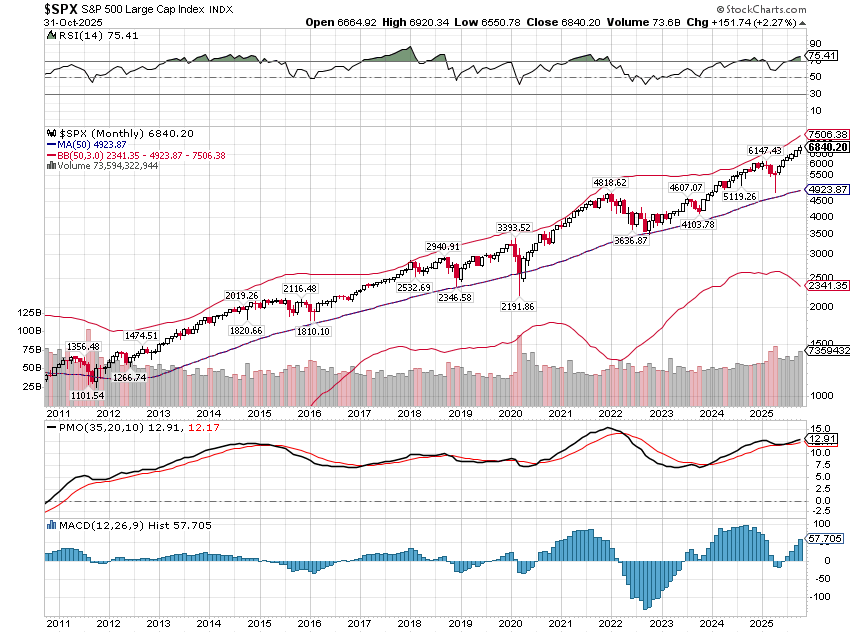
That doesn’t mean the market is about to crash or even correct meaningfully right now. What it means is that investors should be more inclined to sell than buy. If you sell something – for whatever reason – you might consider waiting before reinvesting, holding more cash than usual. If you are considering adding money to the market, maybe think about dollar cost averaging in over a period of time rather than investing all at once. If you have any positions at a loss, now might be a good time to take a tax loss. Or if you own something that hasn’t participated in the bull market, maybe now would be a good time to clean things up. There is a lot of, let’s call it enthusiasm, for the stock market right now (among other things) but prudent long term investors should always be looking to fade the crowd when at an extreme. And today qualifies.
Markets Update
Stocks
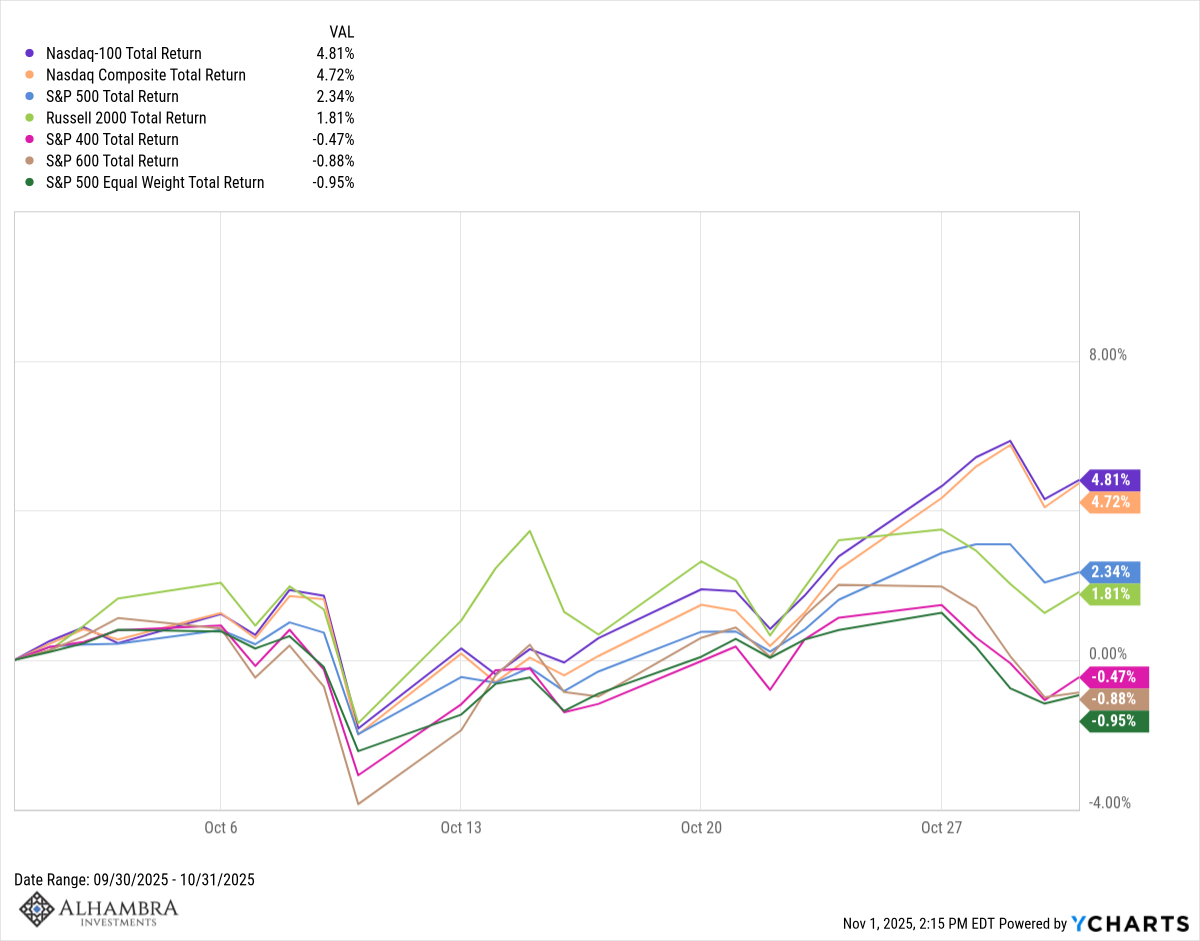
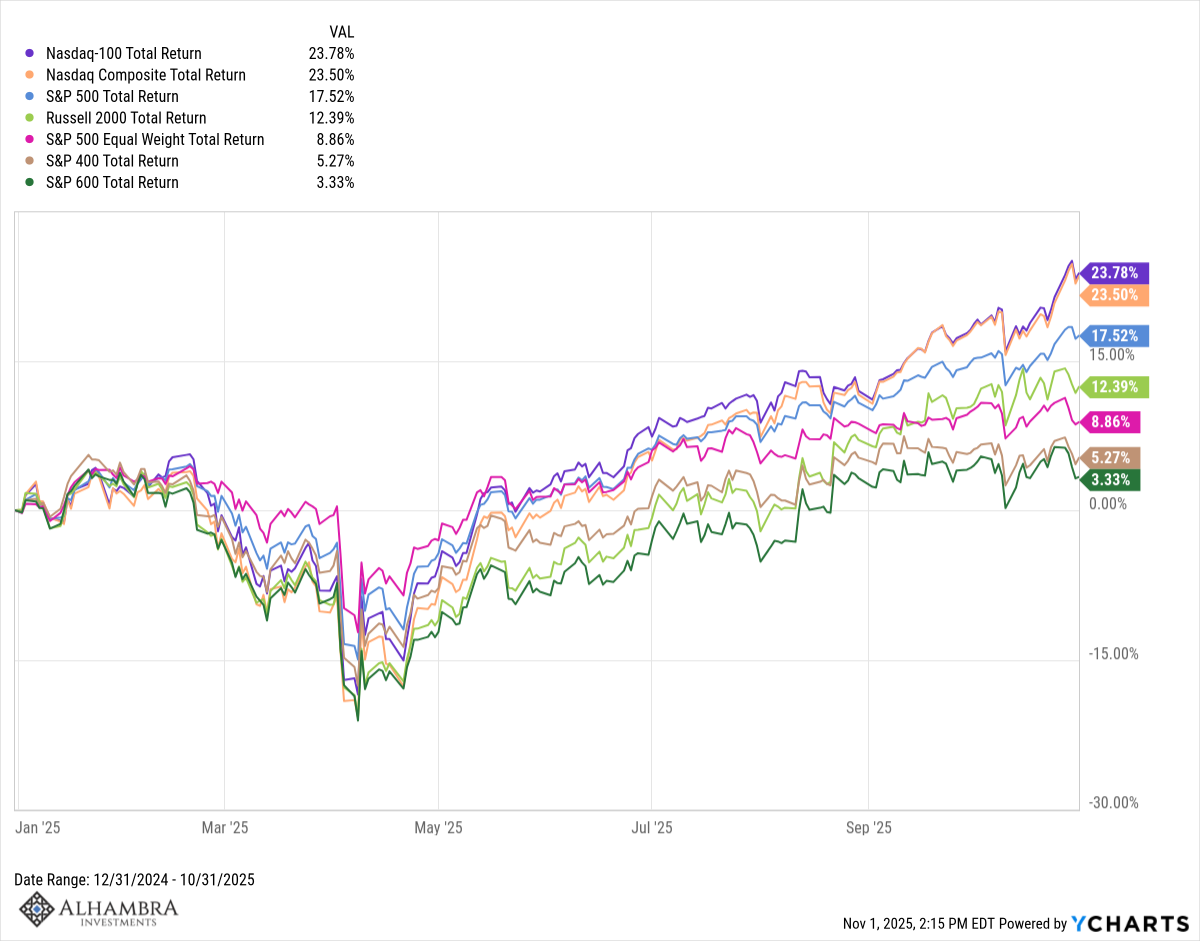
Stocks continued their extraordinary run off the “liberation day” lows in October but the advance continues to narrow. The Nasdaq led the way, rising nearly 5% on the month, its seventh consecutive monthly gain. The only down months this year were February and March. The S&P 500 is also on a run, up 6 months in a row since it showed a small loss in April. Small and mid-cap stocks were mostly lower in October although the speculative Russell 2000 did manage a gain. That also continues a trend; the S&P 400 and 600 (mid and small caps) are up this year but only by low single digits, while the more speculative Russell 2000 is up 12.4%. The S&P SMID indexes are both below their highs of late last year and the small cap index is below its November 2021 peak. This market has been led by large caps to a degree rarely seen but the more dominant theme is speculation.
(Click on image to enlarge)
(Click on image to enlarge)
With all the attention focused on AI stocks and their influence on the S&P 500, non-US markets have quietly outperformed the US by a rather wide margin. That is even more interesting when you consider that the US has imposed tariffs on almost every country in the world. Weren’t tariffs supposed to be a penalty imposed on foreigners for allegedly cheating us on trade? Pardon me for pointing it out, but that doesn’t seem to be working. If markets anticipate what is this recent outperformance discounting?
(Click on image to enlarge)
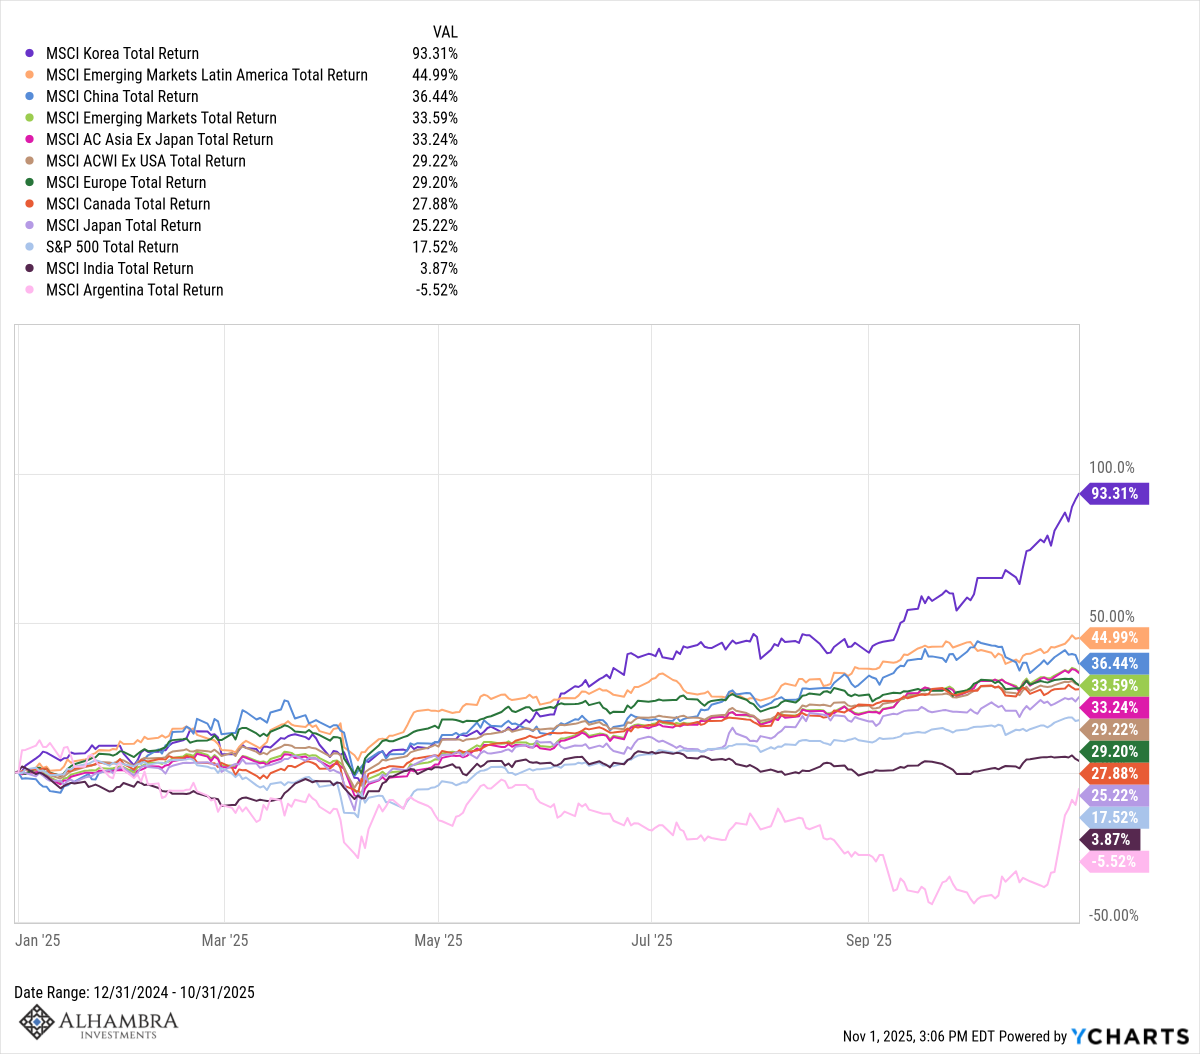
The answer to why non-US markets are outperforming is a difficult one but to me it boils down to “follow the money”. For reasons that go well beyond trade, much of the world has decided the US currency carries some risk they want to avoid. While we can’t say for certain what that risk is, it is pretty obvious that it exists. Treasury Secretary Bessent and Fed Governor/CEA Chair in waiting Stephen Miran expected the dollar to rise this year with the imposition of tariffs because that is what the textbook says to expect. Currencies will generally move to offset the price impact of the tariff; foreign currencies should have fallen to reduce the price of US imports and offset the tariffs. Currency traders apparently don’t read textbooks. Part of the outperformance of international markets this year is nothing more than the change in currency values, but not all. Eurozone stocks are up 34.5% this year in dollars but only a little over a third of that is from the rise of the Euro. What accounts for the other two thirds? Just a thought, but if capital is flowing back to Europe, as it appears to be, it has to be invested somewhere. Capital flows matter a lot to markets and economies.
(Click on image to enlarge)
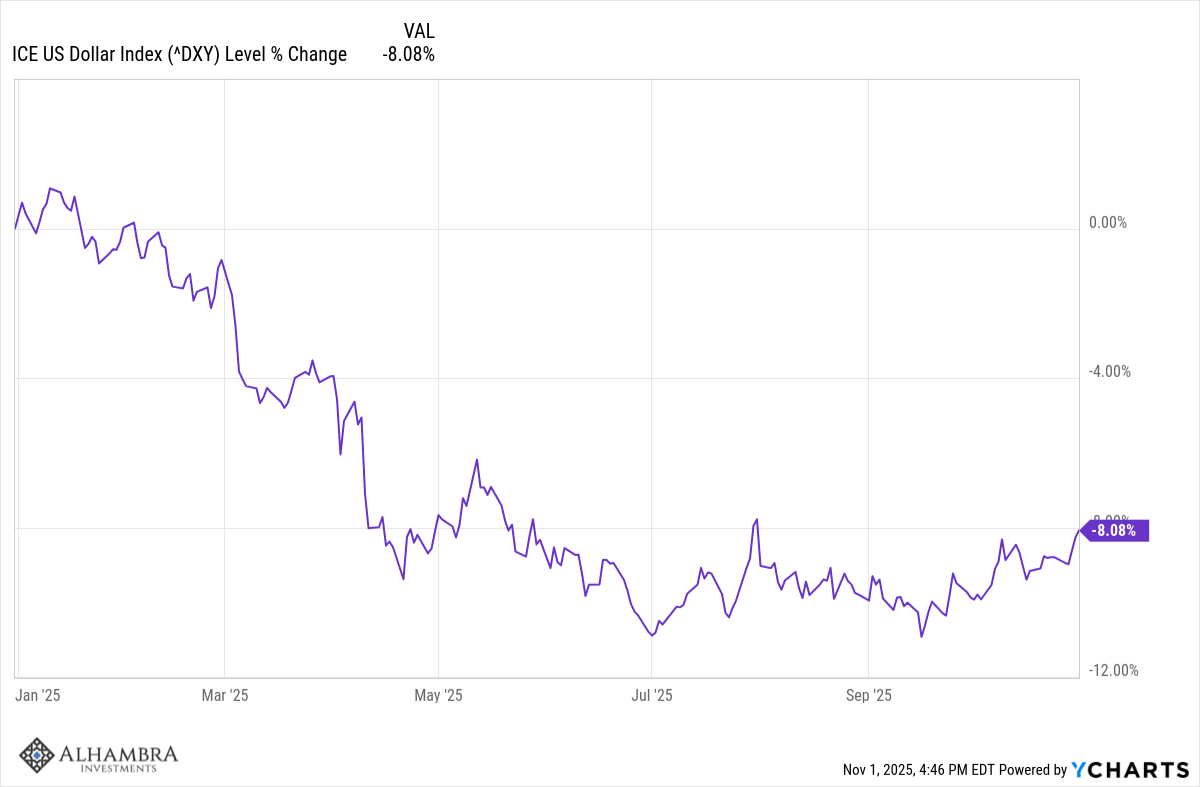
The dollar has firmed up recently – as I expected and wrote about repeatedly over the last couple of months – but the trend is still down for now.
Commodities
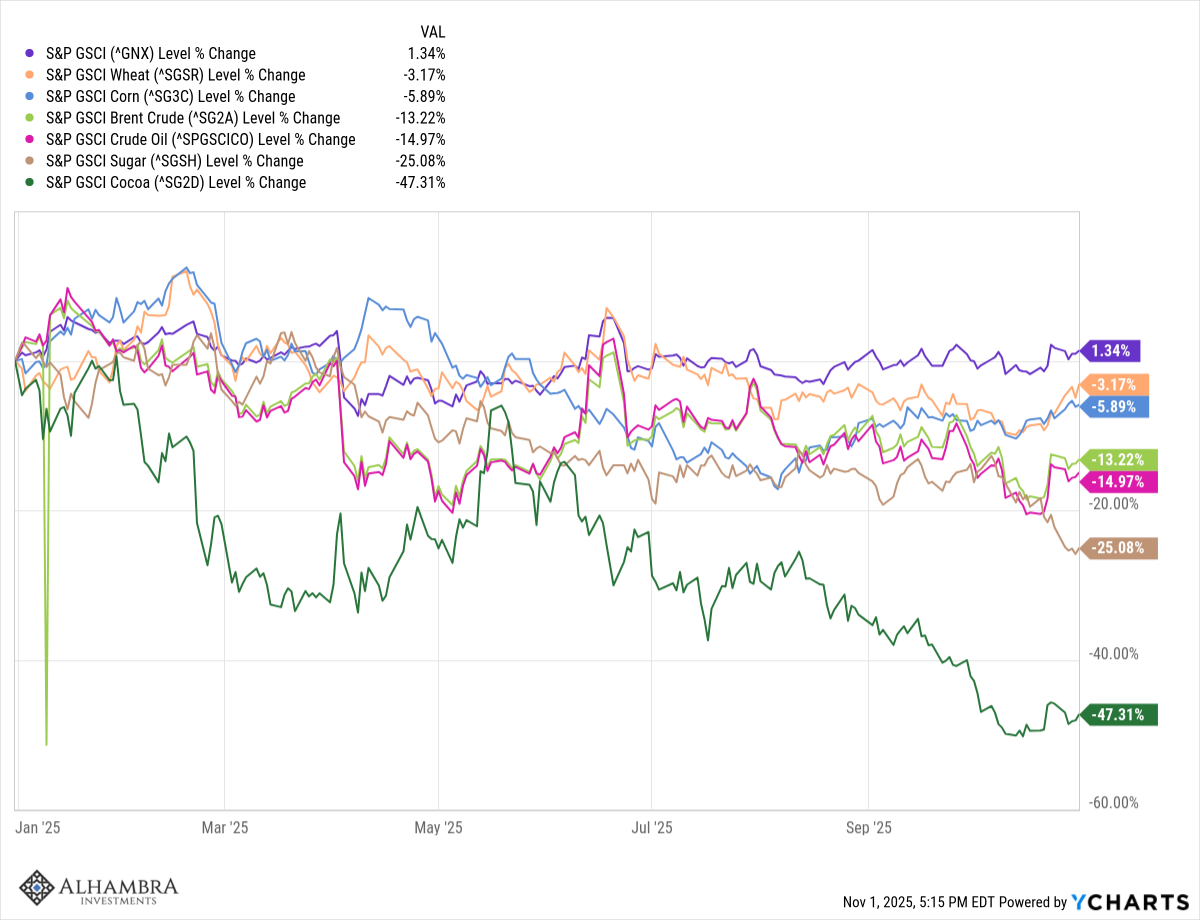
With a weaker dollar, one would expect commodities to perform well and they have although it doesn’t really show up in the index itself, which is only up 1.3% this year. Of the 24 commodity futures contracts included in the S&P GSCI commodity index, only 9 of them are down and 2 of those are down less than 1%. So, if only about 30% of the commodities in the index are down meaningfully, why isn’t the index itself doing better? The reason is simple – crude oil. Energy represents 57% of the index and crude oil 40% by itself. Crude oil isn’t the worst performing commodity in the this year – that would be cocoa (-47.3%), 0.334% of the index – but oil is down 15%.
(Click on image to enlarge)
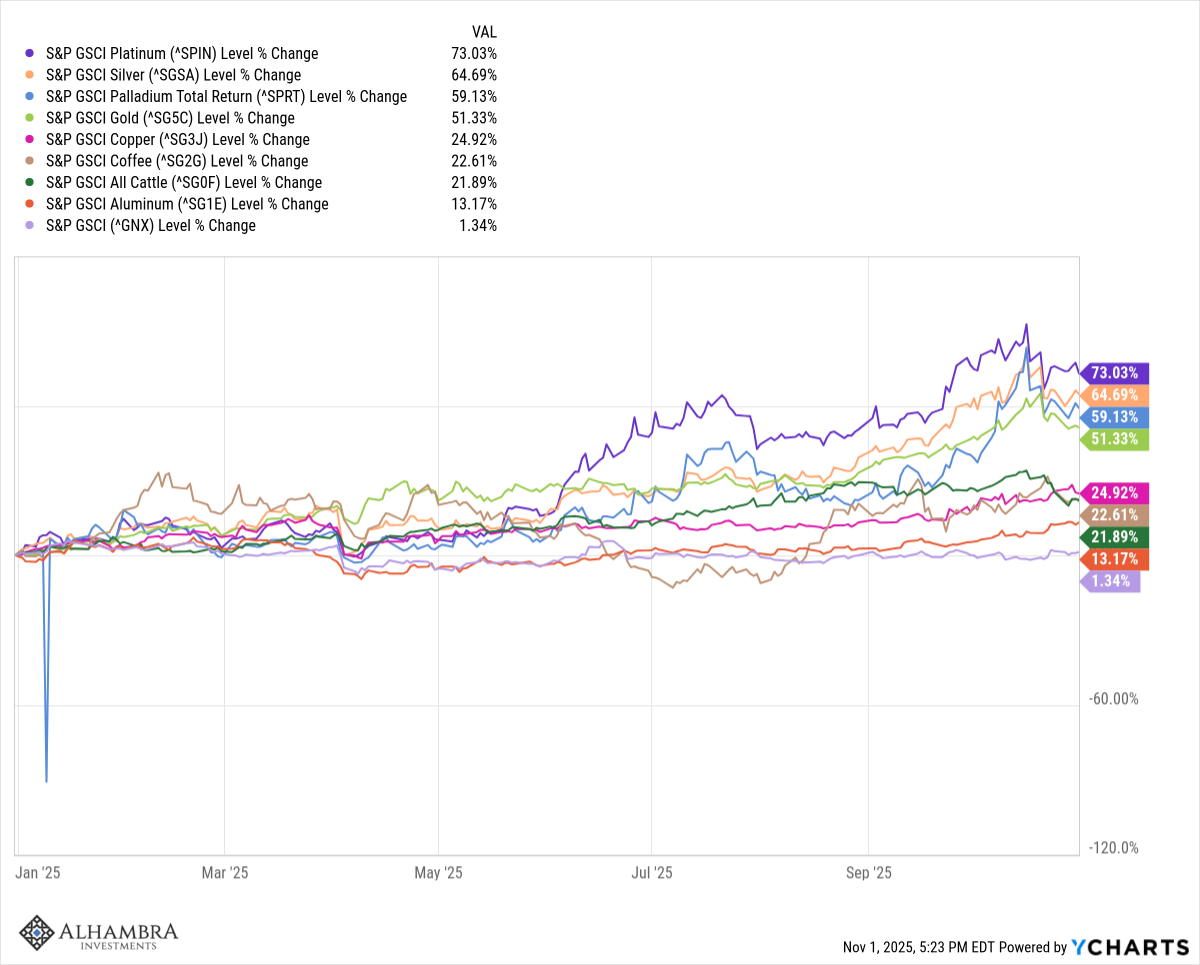
On the upside, the big gainers are mostly metals. Precious metals: Gold (+51.3%), Silver (+64.7%), Platinum (+73%), Palladium (+59.1%). Industrial metals: Aluminum (+13.2%), Copper (+24.9%). But a couple of agricultural commodities have done well too : Coffee (+22.6%), Cattle (+21.9%)
(Click on image to enlarge)
Real Estate
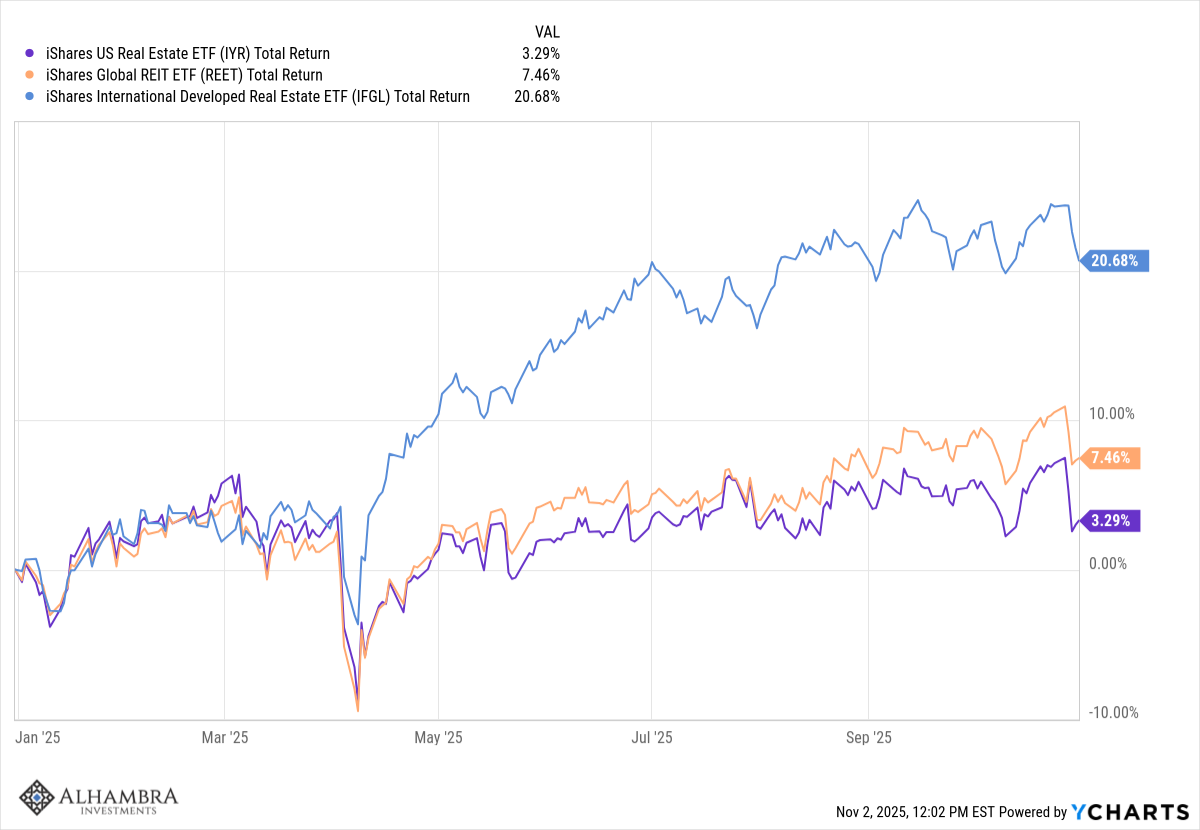
Domestic real estate has struggled this year with the DJ US Real estate index up just 3.8%. International has been the big winner (+20.7%) and global has produced a decent return (+7.5%). All of these returns were higher until the recent rate cut by the Fed. You might think lower rates would be positive for real estate but the Fed only controls short term rates. Long term rates are up about 15 basis points since the last Fed meeting.
(Click on image to enlarge)
Fixed Income
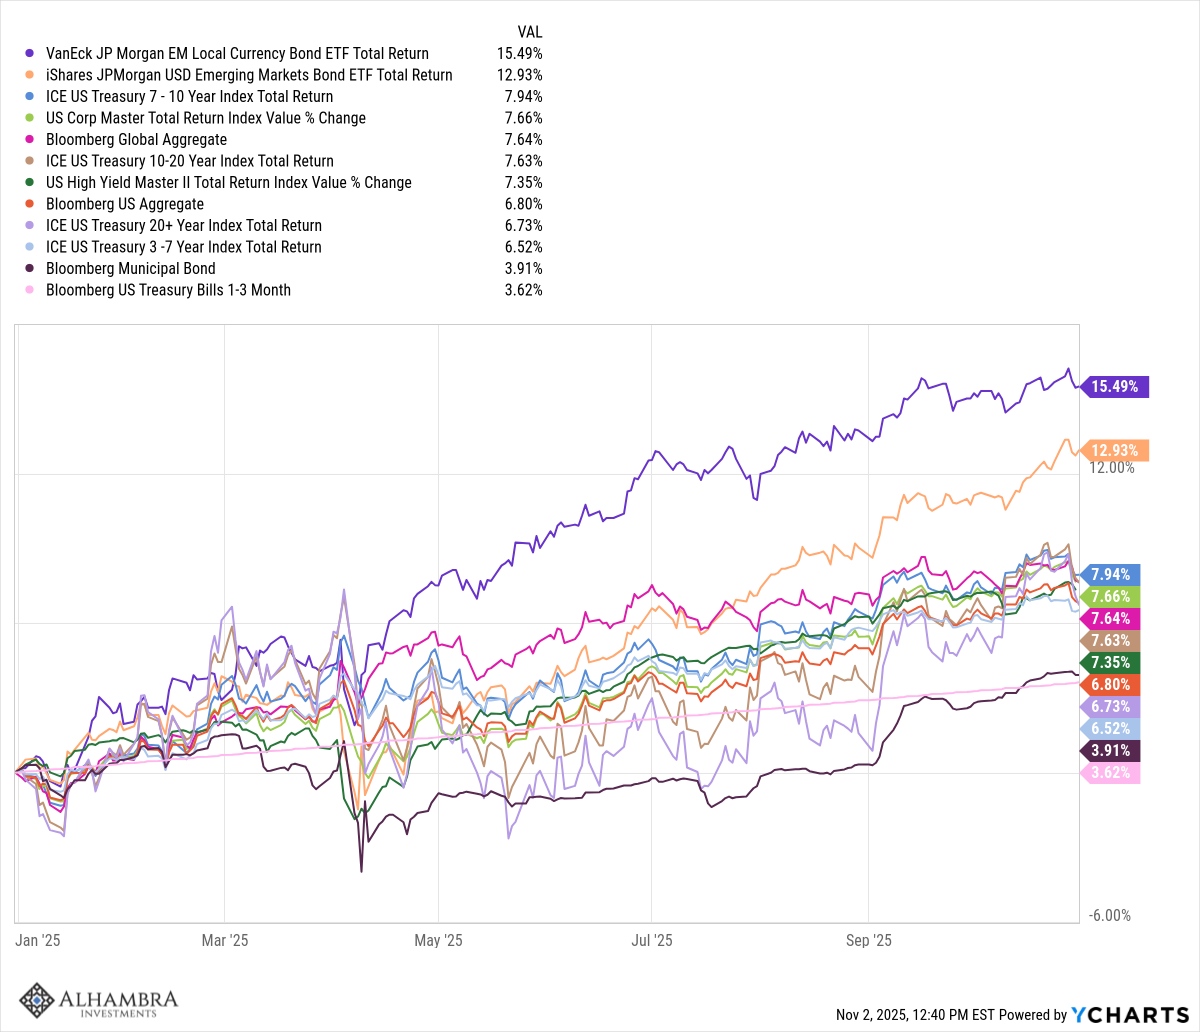
Bonds have produced positive returns this year, the third year in a row if it holds through the end of the year and the best since 2020. The five year return for the intermediate term Treasury index is, however, basically zero. Corporate bonds are the second best performing of the domestic bond indexes we track but over the last five years have produced a slightly negative return. With the dollar falling, international bonds have performed well, particularly EM (dollar and local currency bonds). This is, as with international stocks, partially a function of currency gains.
(Click on image to enlarge)
More By This Author:
Weekly Market Pulse: Wanna Bet?
Weekly Market Pulse: Free Will
Weekly Market Pulse: The Return Of Tariff Man - Monday, Oct. 13
Disclosure: This material has been distributed for informational purposes only. It is the opinion of the author and should not be considered as investment advice or a recommendation of any ...
more

