
.webp)
Photo by Zlaťáky.cz on Unsplash
Gold is having its moment. The yellow metal recently neared $3,900 per ounce. Goldman Sachs analysts call it their “highest conviction” trade. Central banks can’t buy it fast enough. The financial media tracks every new record.
No wonder gold has been a record breaker. It left its 2011 all-time high in the rearview mirror back in early 2020 and never looked back. Over the past month alone, gold notched eleven separate record highs.
In case you’re wondering if you missed the boat, my answer is a definite no. But if you’re looking to buy into something that may have a little more punch left in the tank, you couldn’t go wrong with silver.
Here’s what many people don’t know: silver – even at nearly $48 – is gold’s smaller, scrappier cousin that STILL hasn’t broken its 2011 peak of $49 per ounce. Take a look at the next chart.
(Click on image to enlarge)
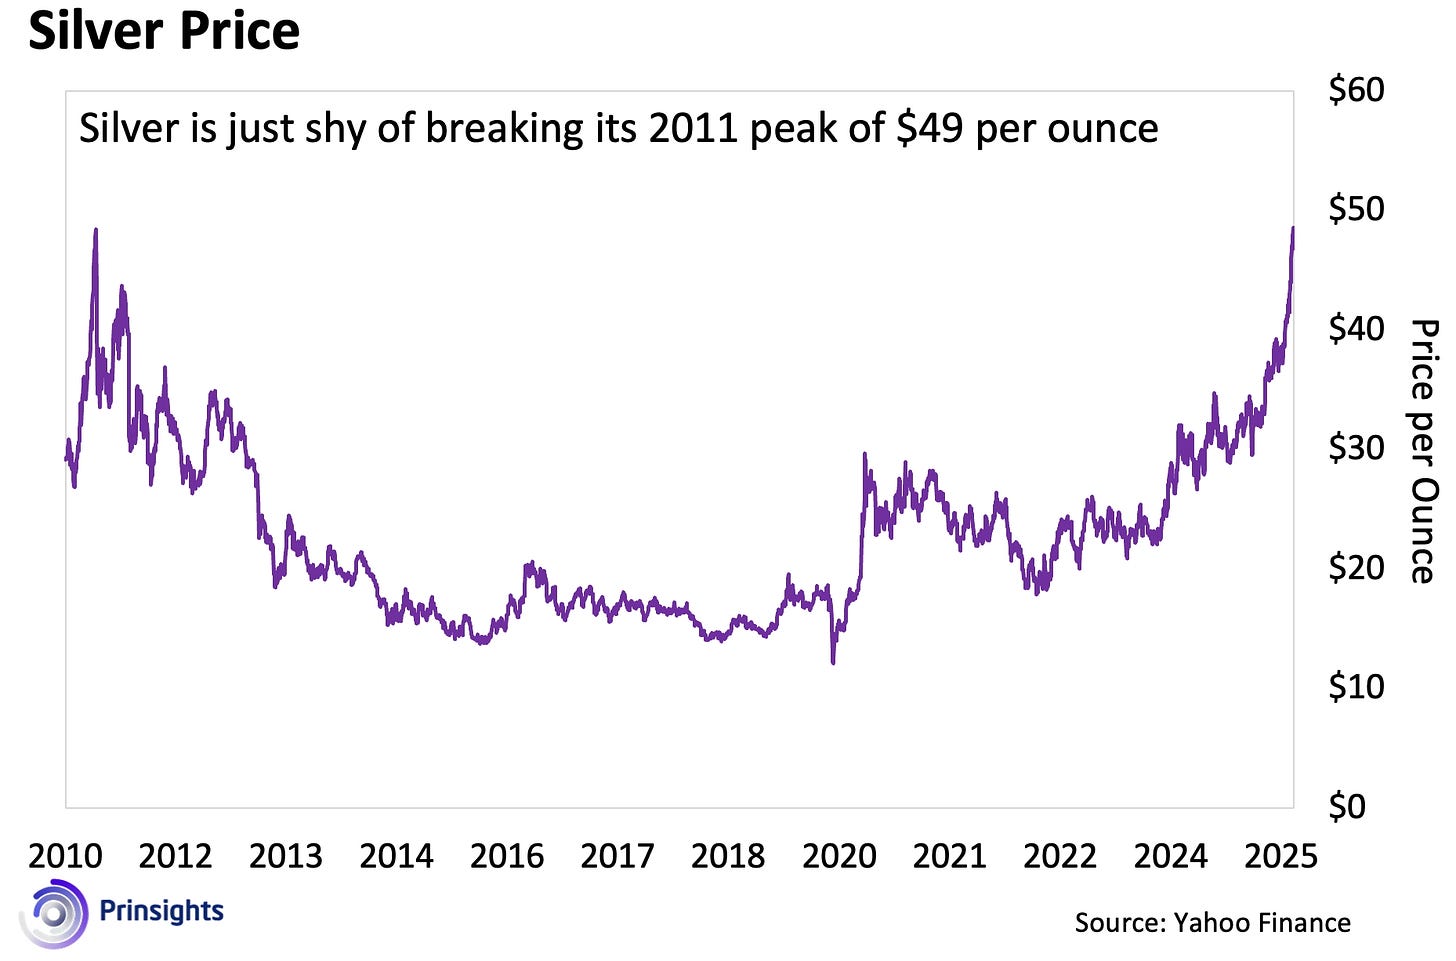
That gap tells you everything you need to know about where the real opportunity lies.
The Pattern That Repeats
So, what’s going on here?
Well, you need to remember – silver tends to trail behind gold in performance. That’s why it didn’t do as well as gold in 2022 and 2023. But it surpassed gold with gusto in 2024.
More importantly, when silver catches up to gold, it tends to keep going – just like it did during the pandemic in 2020. Take a look at the chart below.
(Click on image to enlarge)

For most of that year, silver tracked gold almost tick-for-tick, as if it was afraid to break out on its own. Investors were skeptical. “Silver’s had its day,” they said. “This is gold’s cycle.”
Then July and August happened. Silver didn’t just catch up – it exploded. By year-end, silver had gained 47% compared to gold’s respectable but modest 24%. Nearly double the returns in half the time.
We might be watching that exact setup unfolding right now.
Silver is up roughly 62% over the past year – but most of those gains came from the past month or so. And like I said, we’re not even past the last all-time high yet. Yes, this puts silver ahead of gold’s nearly 50% performance, but not by much, which could mean the party is just getting started.
Why Silver Behaves Differently
One reason behind silver’s peculiar behavior is that it’s mainly a byproduct of industrial metal mining or gold extraction. This means silver supply doesn’t react as directly, or as rapidly, to market price or demand increases as gold does. The metal has to wait for zinc, lead, copper, or gold mining to expand – which can take years.
Then there’s the matter of size.
The worldwide silver market is tiny compared to other major commodities – roughly 10% the size of gold, copper, or iron markets. Take a look at the chart below.
(Click on image to enlarge)
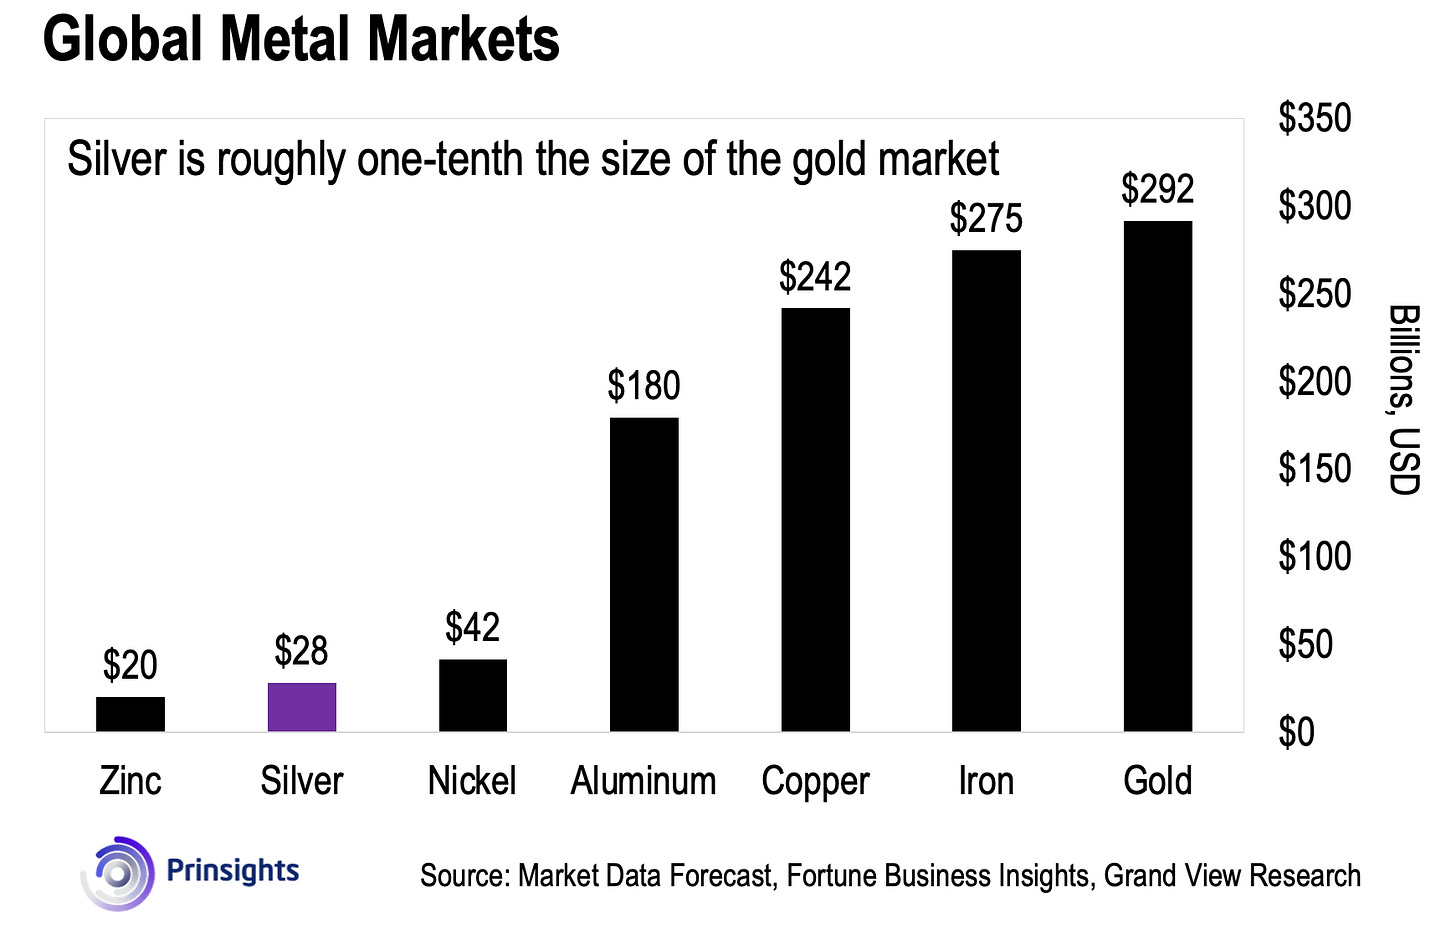
That small size creates volatility. But it also means even modest capital flows can move prices dramatically.
People who treat silver as “poor man’s gold” – a cheap alternative for those who can’t afford the real thing – don’t understand these realities. But this is precisely what makes silver a coiled spring.
Imagine even a fraction of the institutional capital currently sitting in gold pivoting to silver. The impact on a market that’s 10% the size would be explosive.
And yes, those institutions could eventually include central banks. Many people don’t realize this, but central banks can buy silver. There’s historical precedent for it. As monetary authorities seek to diversify away from the U.S. dollar amid geopolitical fragmentation, and as gold starts looking expensive, silver could become an increasingly attractive alternative.
Consider what’s happened with gold over the past three years. Central banks have been accumulating over 1,000 tons annually (adding 415 tons in the first half of 2025). That’s up from an average of just 400–500 tons a year in the decade before 2022. It’s this sustained buying that helped establish a robust price floor for gold and pushed it to new all-time highs.
Central banks buying silver may be speculation at this point. But it’s worth keeping on your radar, because any move in that direction would light a fire under the metal.
The Stock Opportunity Is Even Bigger
I mentioned above that despite all its recent gains, silver hasn’t broken above its all-time high.
But this “still below 2011” situation is even more extreme for silver stocks. Look at the chart below: despite gaining over 40% in the past year, the Global X Silver Miners ETF (SIL) is still sitting about 15% below its 2011 peak.
(Click on image to enlarge)
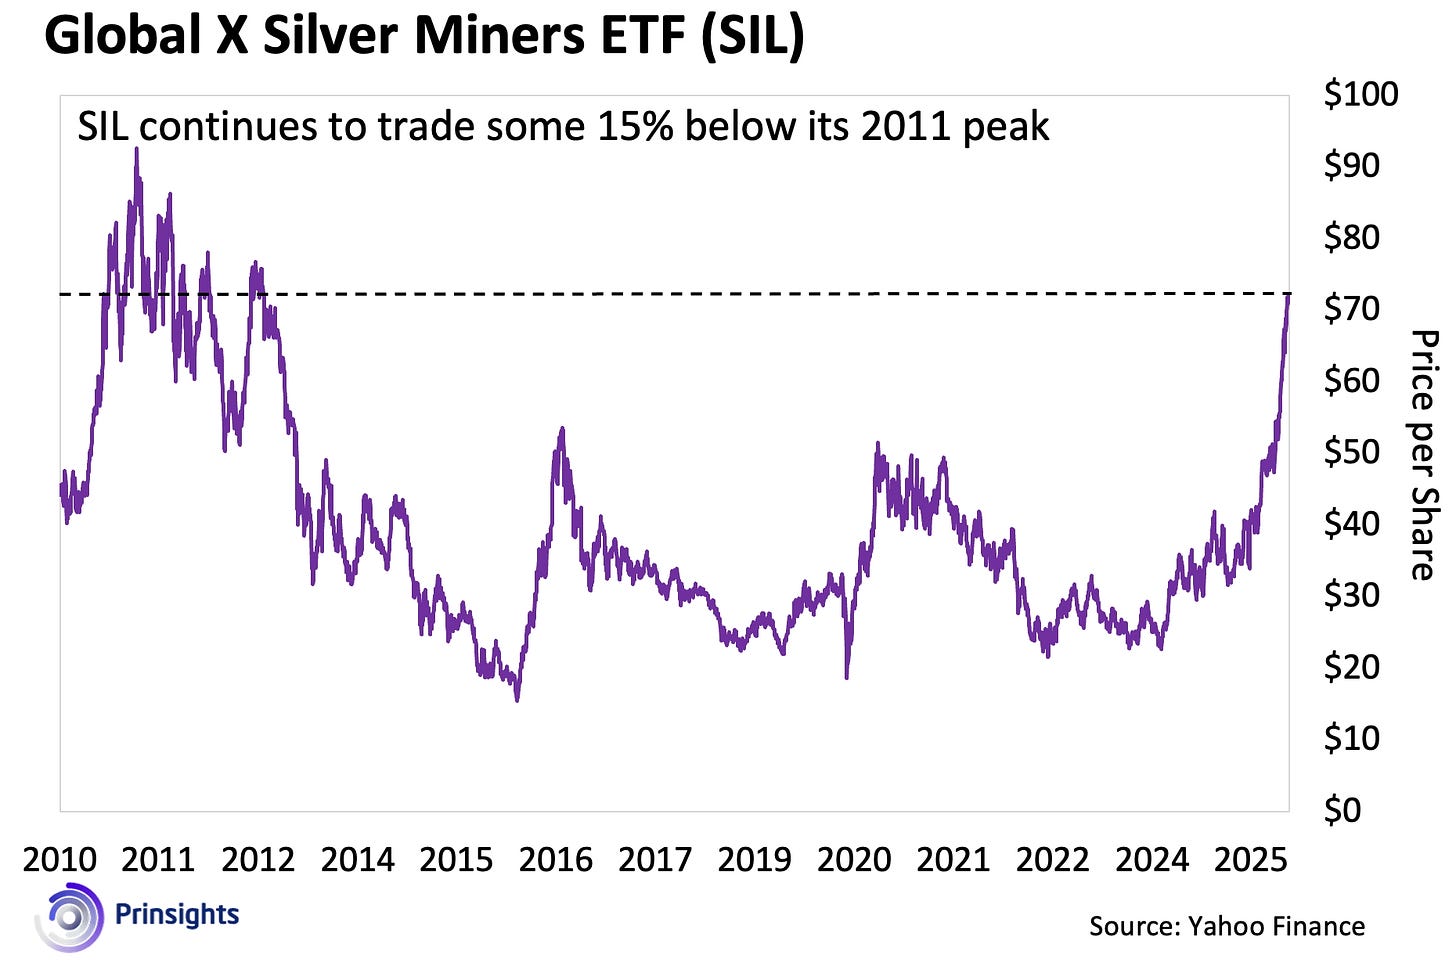
This means one thing: silver stocks have even more room to run.
What’s also striking is that SIL is up only about 130% over the same period. That might sound like a lot, but it’s not even twice the metal’s performance. In a true silver bull market, you’d expect 3x leverage or more.
These disconnects won’t last. When silver finally breaks out above its 2011 highs and starts making new records – and it will – those mining stocks will move fast. The leverage that’s been dormant for years will suddenly kick in, and investors who waited for “confirmation” will be chasing prices.
More By This Author:
Nuclear Momentum: September Signals That Can’t Be Ignored
What Wall Street Knows About This Fed
Fast-Tracking Uranium Changes Everything

Comments
Log in or sign up to join the conversation.