
Gold: Investor Tactics For 2023
For 2023, my suggested “average investor portfolio” is 40% gold (or 40% silver for silver bugs), 40% fiat, and 20% everything else. Aggressive investors will want more of the “everything else” category.
For a look at the US stock market:
(Click on image to enlarge)
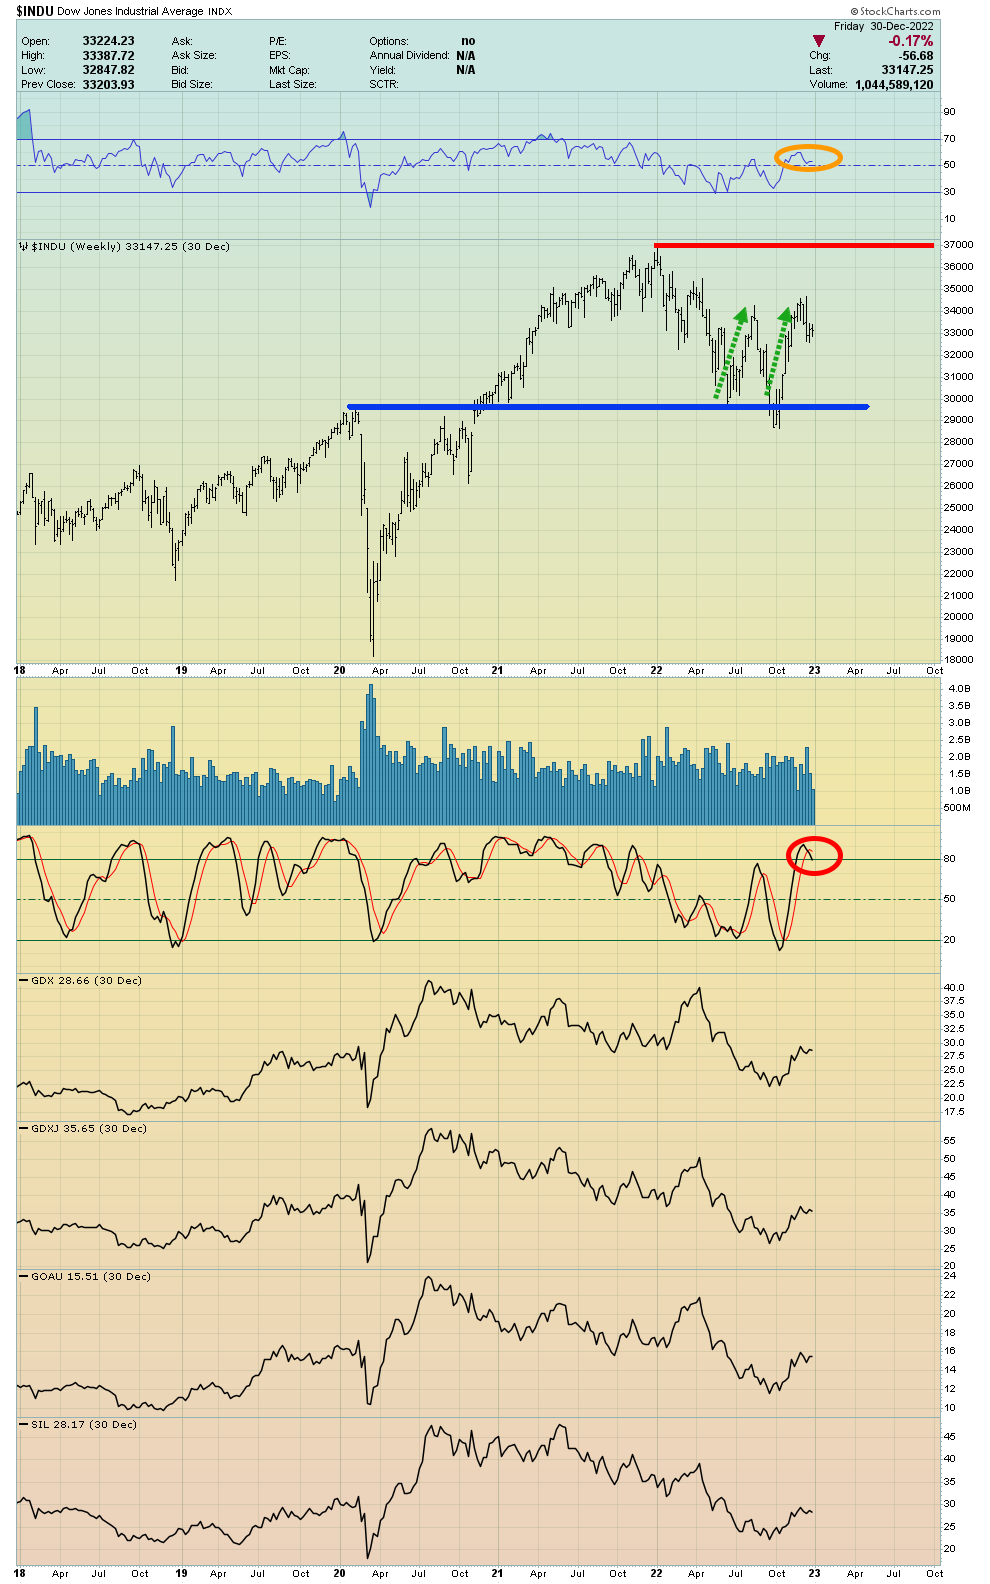
The weekly chart Stochastics oscillator is overbought but RSI is not.
There were two great rallies in 2022 from my Dow 30,000 buy zone… but from a tactical perspective, those are done so profits should be booked.
Stock market investors should pay attention to the closing price on Friday because the first trading week of January often sets the tone for the year.
Regardless, investor patience will be very important in 2023; lots of volatility with minimal overall progress (at best) is likely to be the main theme.
(Click on image to enlarge)
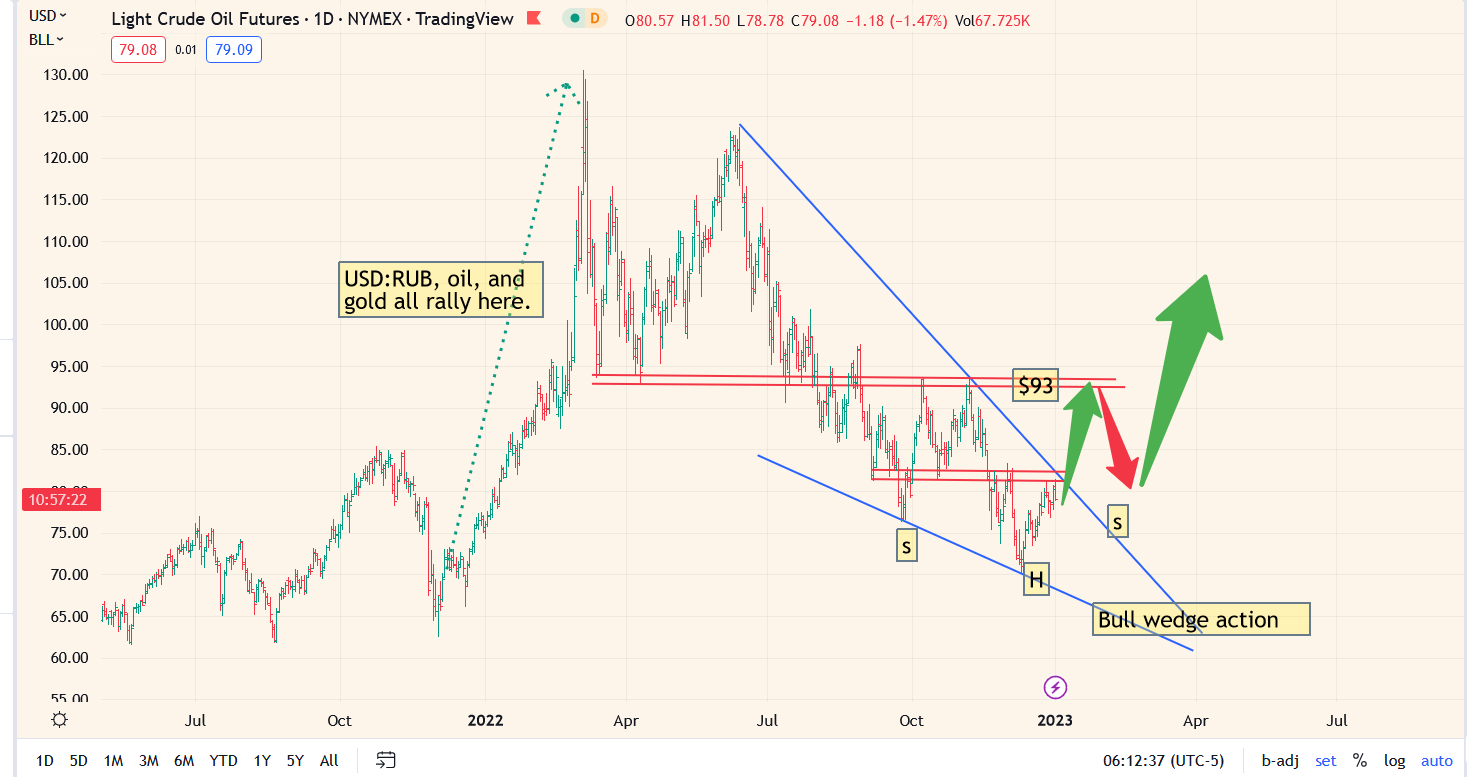
oil price chart.
Unlike the general stock market, oil stocks did incredibly well in 2022.
Oil stocks may have the same great performance this year, but they are still likely to rise if the stock market rises, and they could surge again if the US government’s deranged war-mongering creates more frozen supply chains and another wave of inflation.
(Click on image to enlarge)
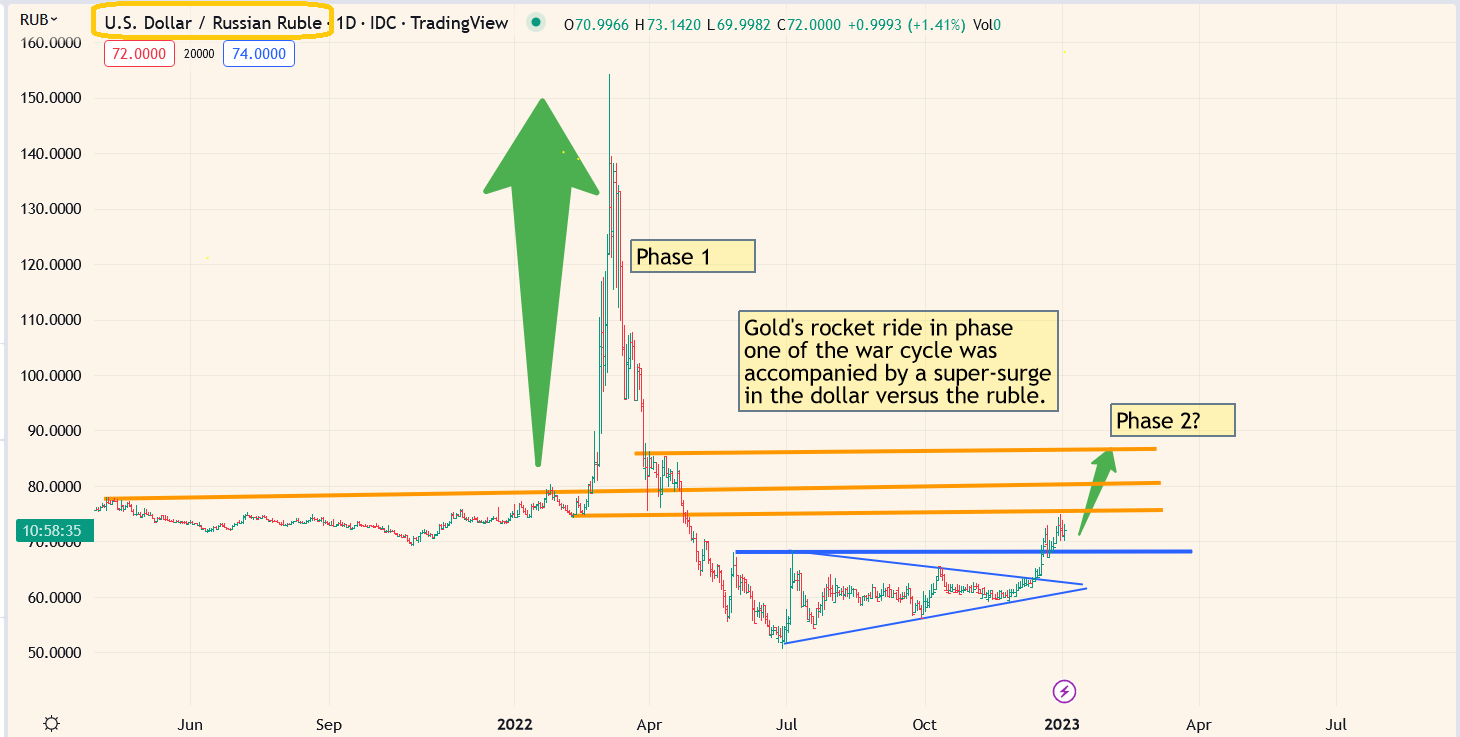
The dollar continues to look perky against the ruble and the 2021-2025 war cycle has 3 years to go.
I like a 40% allocation to fiat, not because it’s a great asset, but because citizens need it to buy most things… and because (unfortunately) it’s the lifeblood of governments.
They will do literally anything they need to do (most of it unethical) to keep their pillars of fiat and debt intact.
Conservative investors could buy T-bills and short-term bonds. I prefer cash, so I’m emotionally unhindered and can act decisively if a good opportunity appears in commodities, crypto, or gold stocks.
A 40% allocation to gold (or more) has served investors well for thousands of years. For a look at the weekly gold chart
(Click on image to enlarge)

Gold was poised to make a run to $3000 in 2022, but instead of breaking out of the huge inverse H&S chart pattern, it’s been drifting sideways.
Stochastics is overbought but RSI is not (like the Dow).
For a look at the daily chart
(Click on image to enlarge)
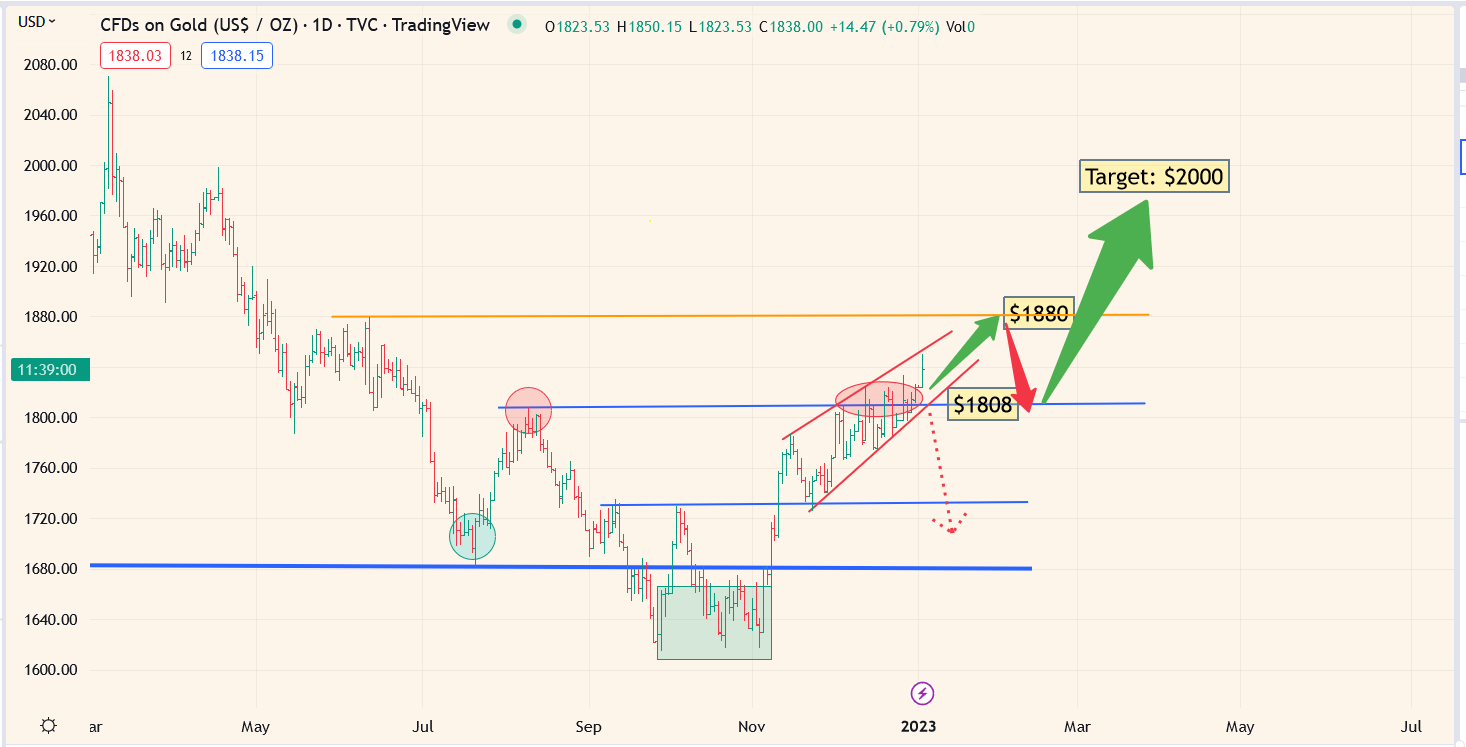
While the rally from $1610 has lost momentum, it looks like gold can reach my next sell zone of $1880 before a more meaningful pullback occurs.
(Click on image to enlarge)
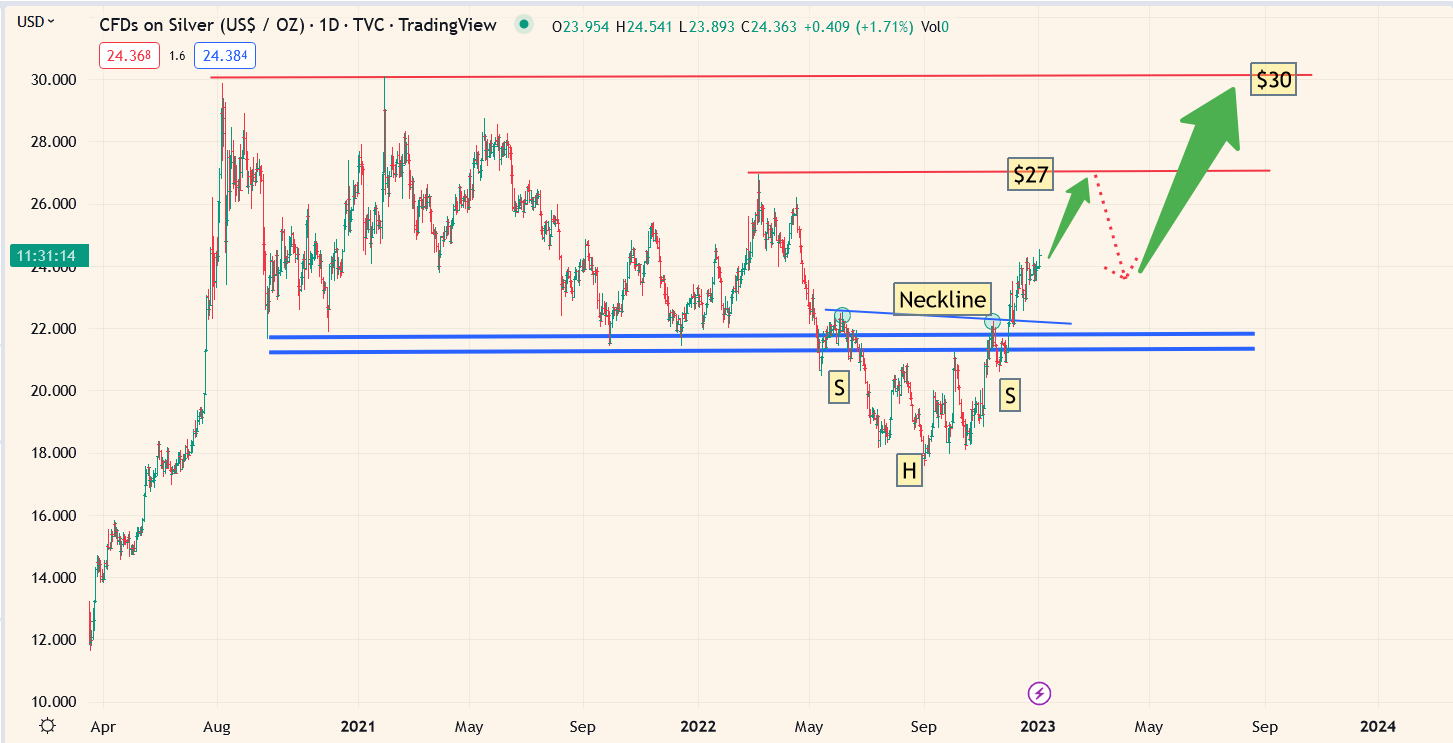
Can silver really rally all the way from $17 to $27 before having a meaningful pullback?
It can, and silver tends to rally most strongly in the late stage of a rally for gold. If gold can reach $1880, silver can easily reach $27.
What about platinum?
(Click on image to enlarge)
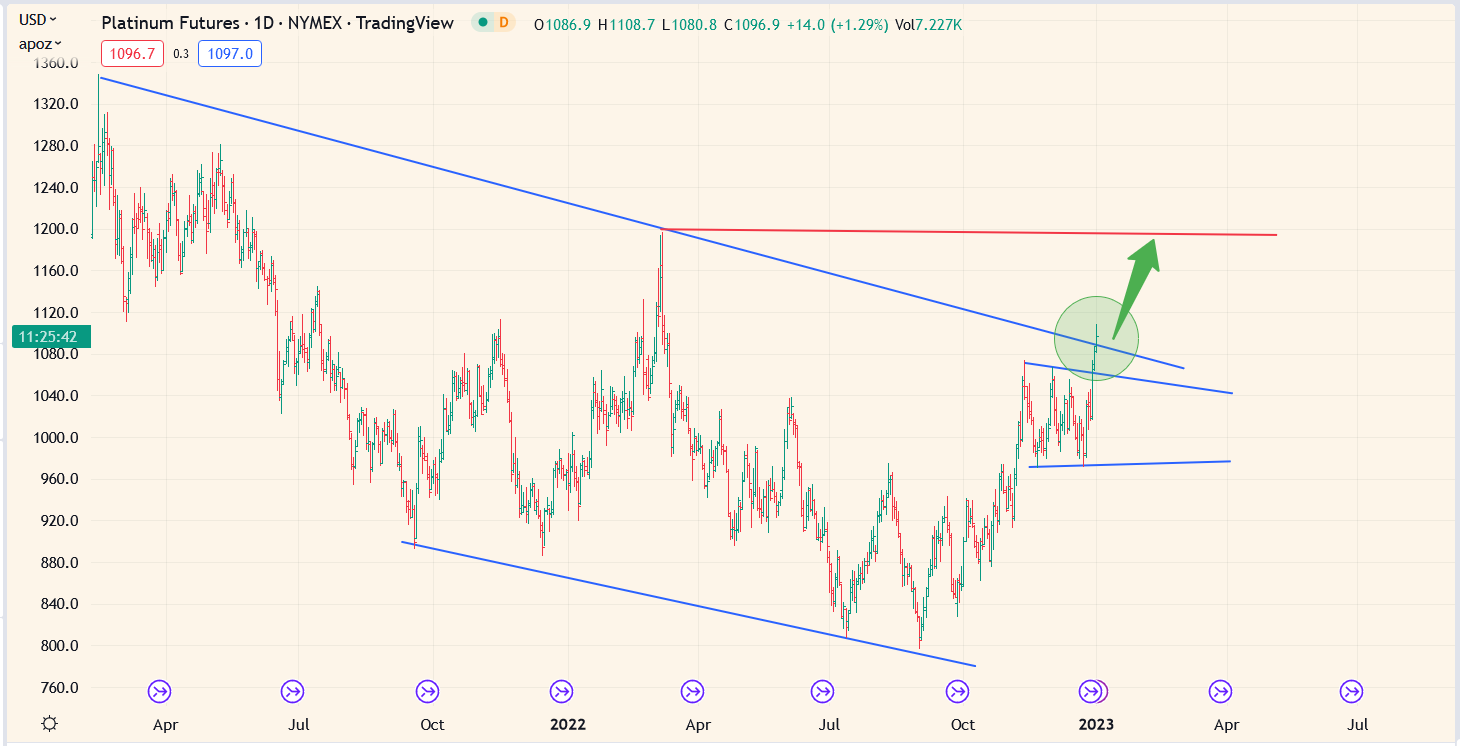
Multiple chart pattern breakouts are in play and a surge to $1200 looks imminent.
Platinum is part of the “20% for everything else” part of my portfolio, and it’s a decent holding for anyone in my professional opinion.
(Click on image to enlarge)

platinum versus gold ratio chart.
There’s a rough base pattern and it’s quite large.
My suggested approach for platinum bullion is to buy it in a modest size on all $100/oz dips.
Aggressive gold bugs forgo the 40-40-20 portfolio, and many prefer to be nearly 100% invested in the miners.
How did that work out in 2022? Well, the CDNX junior mines index floundered, but GDX and GDXJ faired reasonably well, especially given the flat year in gold and the terrible year for the stock market.
(Click on image to enlarge)
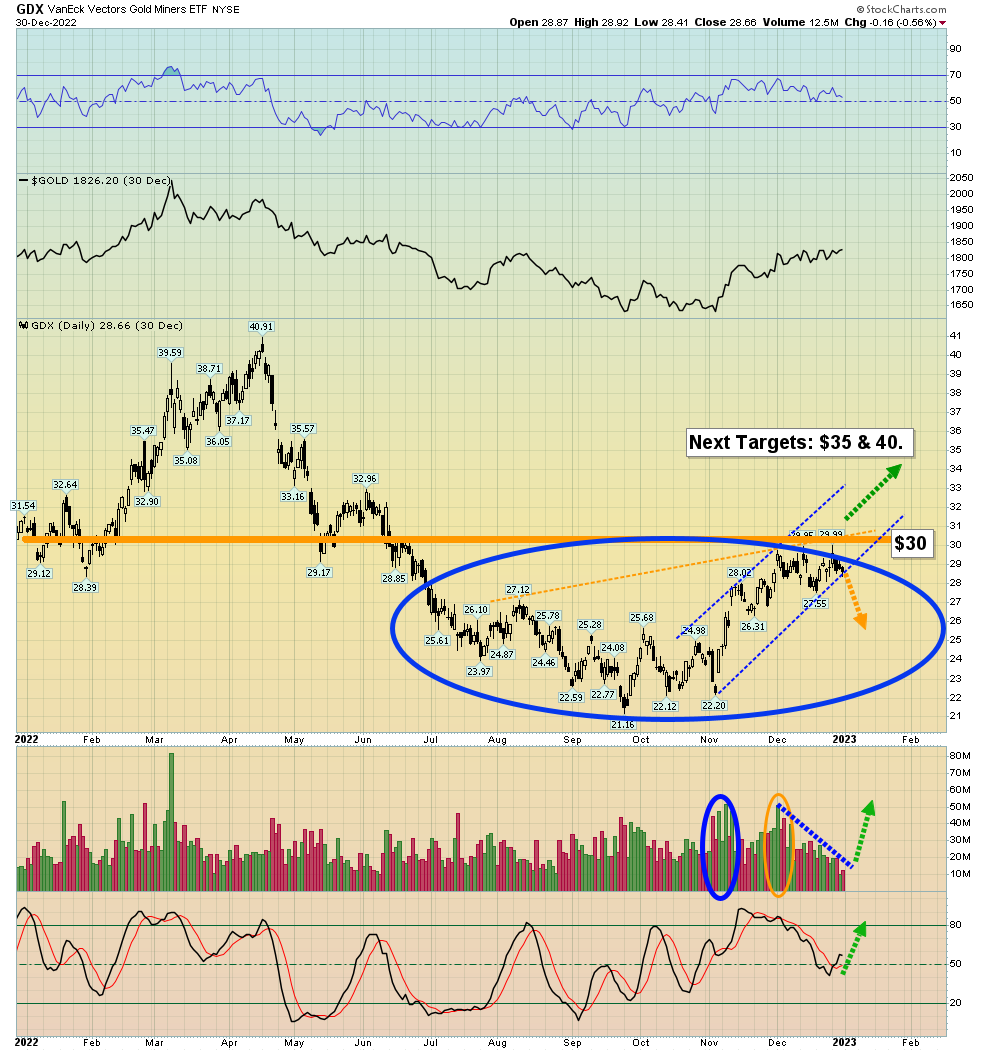
GDX daily chart.
Note the bullish volume pattern at the bottom of the chart. A Friday close above $30 with decent volume is needed to usher in a real upside breakout. Will a rally to $1880 for gold be enough to get that job done? The answer is likely… yes!
More By This Author:
The Winner Is Gold
Gold, War, & Central Bank Panic
An Era Of Stagflation: Investor Tactics


