
Gold, War, & Central Bank Panic
The 2021-2025 war cycle requires investors to focus their attention on the US dollar and gold.
(Click on image to enlarge)
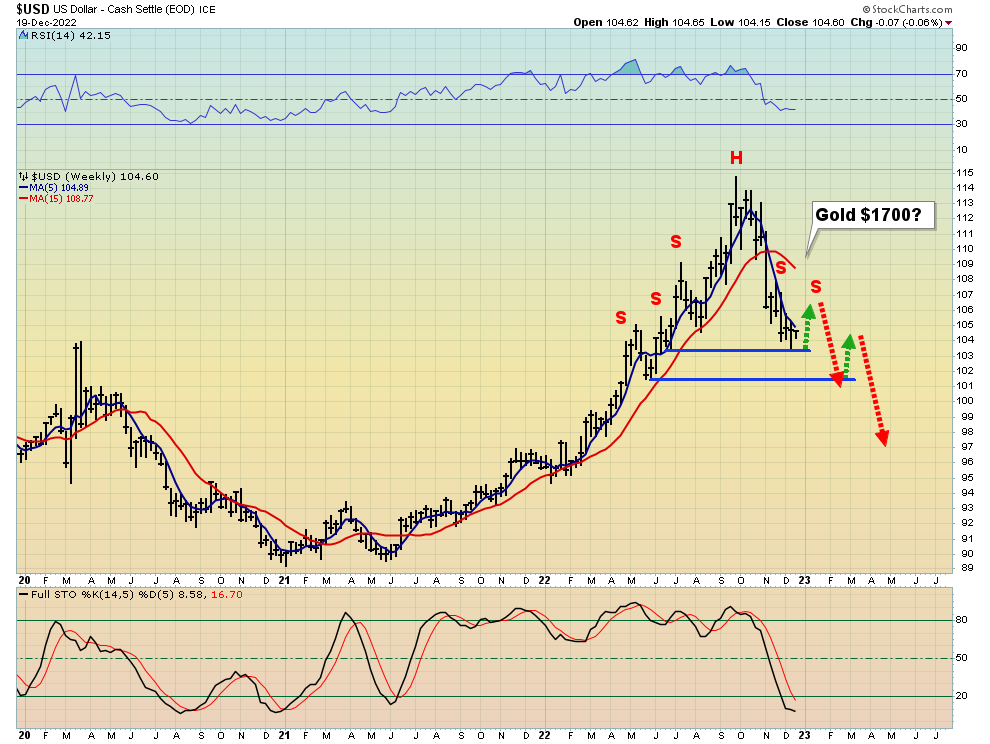
disturbing USDX chart
The chart looks terrible… and the fundamentals look worse.
The dollar initially rallied on the “great news” that Joe Biden was ruining millions of innocent citizens of Europe with his deranged sanctions scheme. European middle earners and the poor were essentially waylaid.
European governments gleefully backed the American scheme, and the euro imploded against the dollar. Since then, the situation has worsened in Europe, but it’s started to disintegrate in America: The stock market rally has failed. Earnings are poised to collapse while Joe continues to intensify his war-mongering.
The USDX is important… and so is USD:RUB.
(Click on image to enlarge)
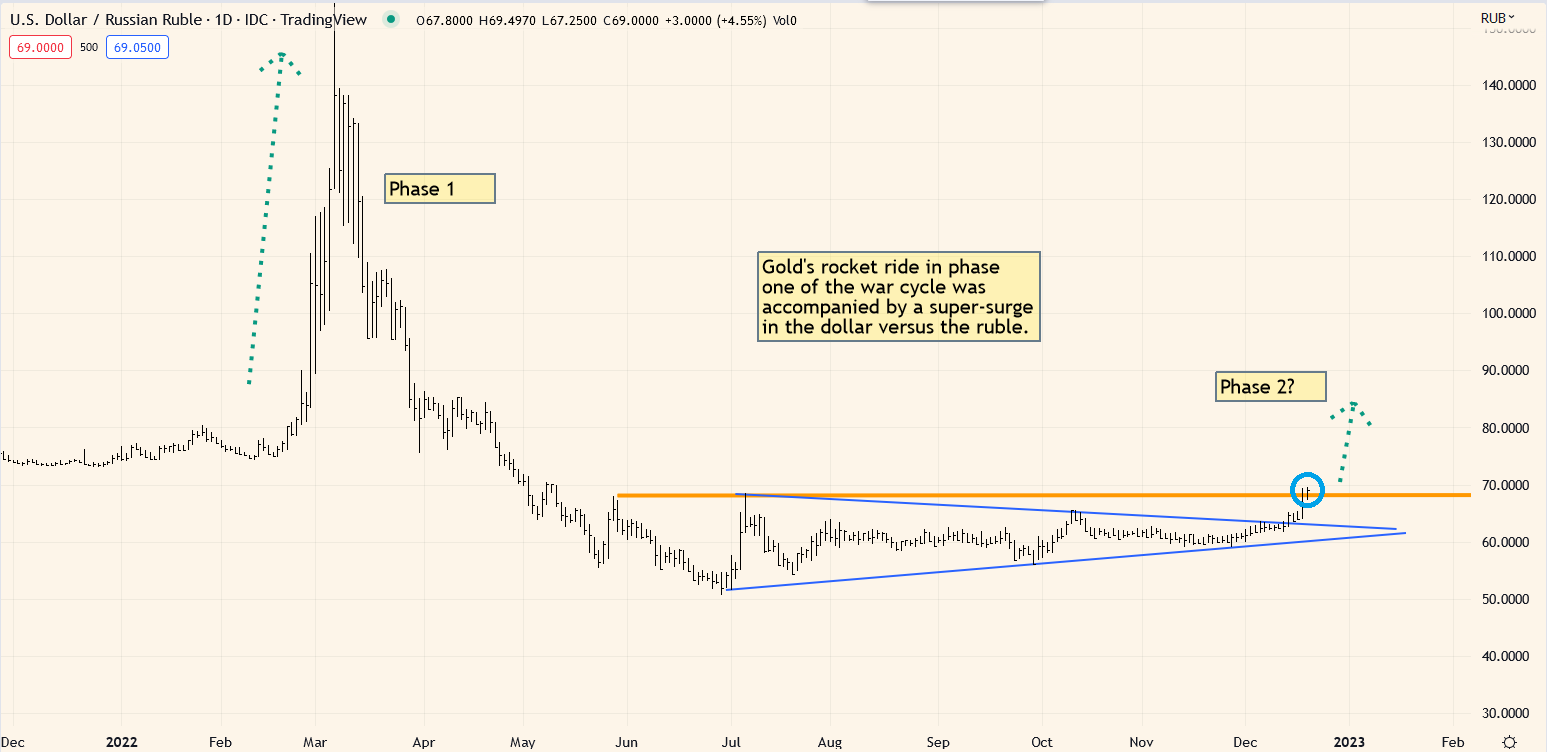
It’s critical that every gold bug in the world pay close attention to this chart. It suggests (as do the charts for gold and oil) that a horrifying new phase in the war cycle is about to begin.
The American government failed with its war in Korea, failed in Vietnam, failed in Afghanistan, failed in Iraq, failed in Libya, and failed in Syria. The bottom line: The American government has the power of fiat and a lot of weapons, but it’s a consistent loser in its wars.
It’s obvious that there won’t be any grand victory for the American government in this new war against Russia, nor against China in what is likely to be the next one. The failure this time will likely be worse than all the failures of the past. There will be decades of stagflation-oriented pain for US citizens and… much higher prices for gold.
(Click on image to enlarge)

oil chart.
It shows two bull wedge patterns in action and a major upside breakout appears to be imminent.
(Click on image to enlarge)
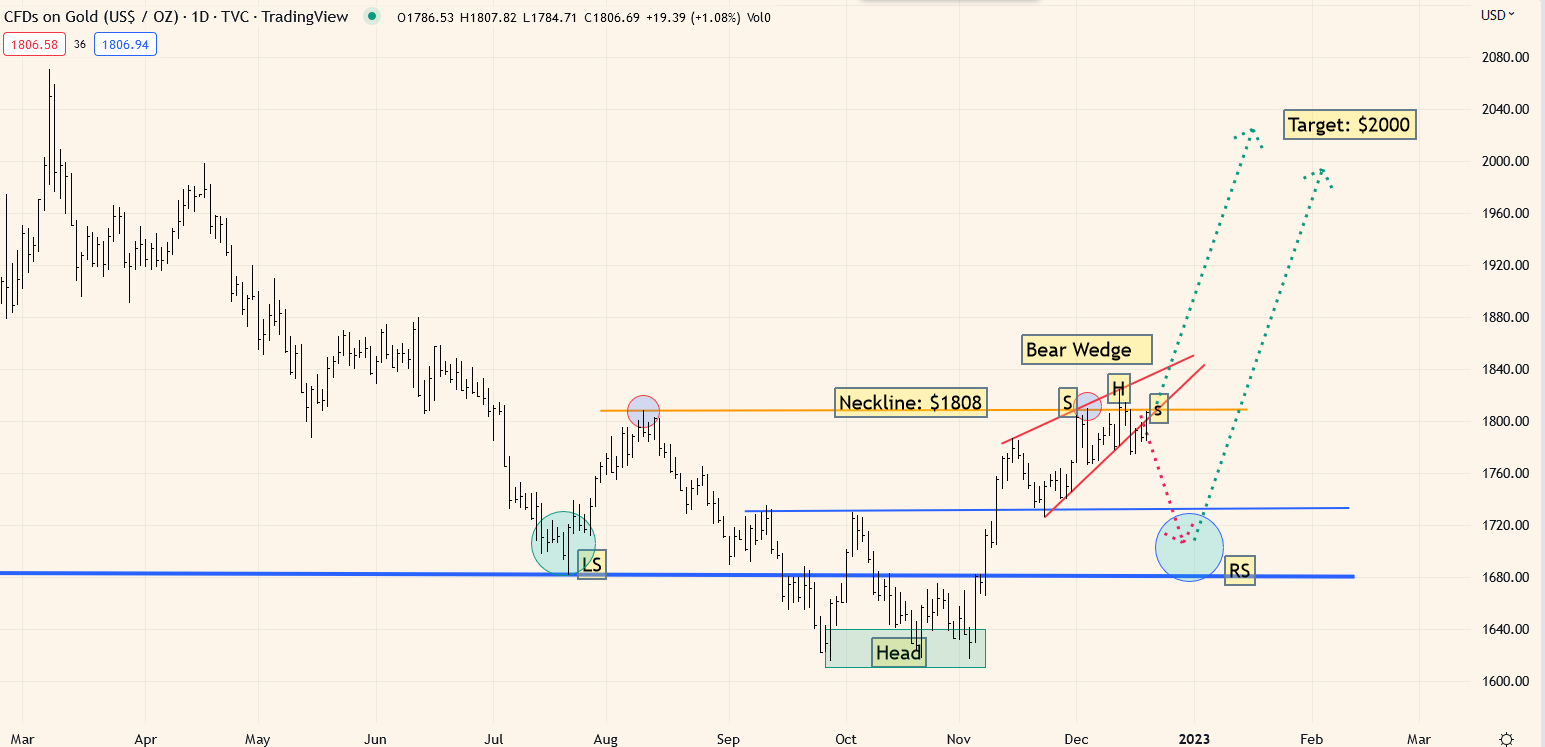
All the gold charts are incredibly positive. The only question is whether a right shoulder forms now as part of a beautiful inverse H&S pattern, or gold simply begins a vertical move toward $2000.
(Click on image to enlarge)
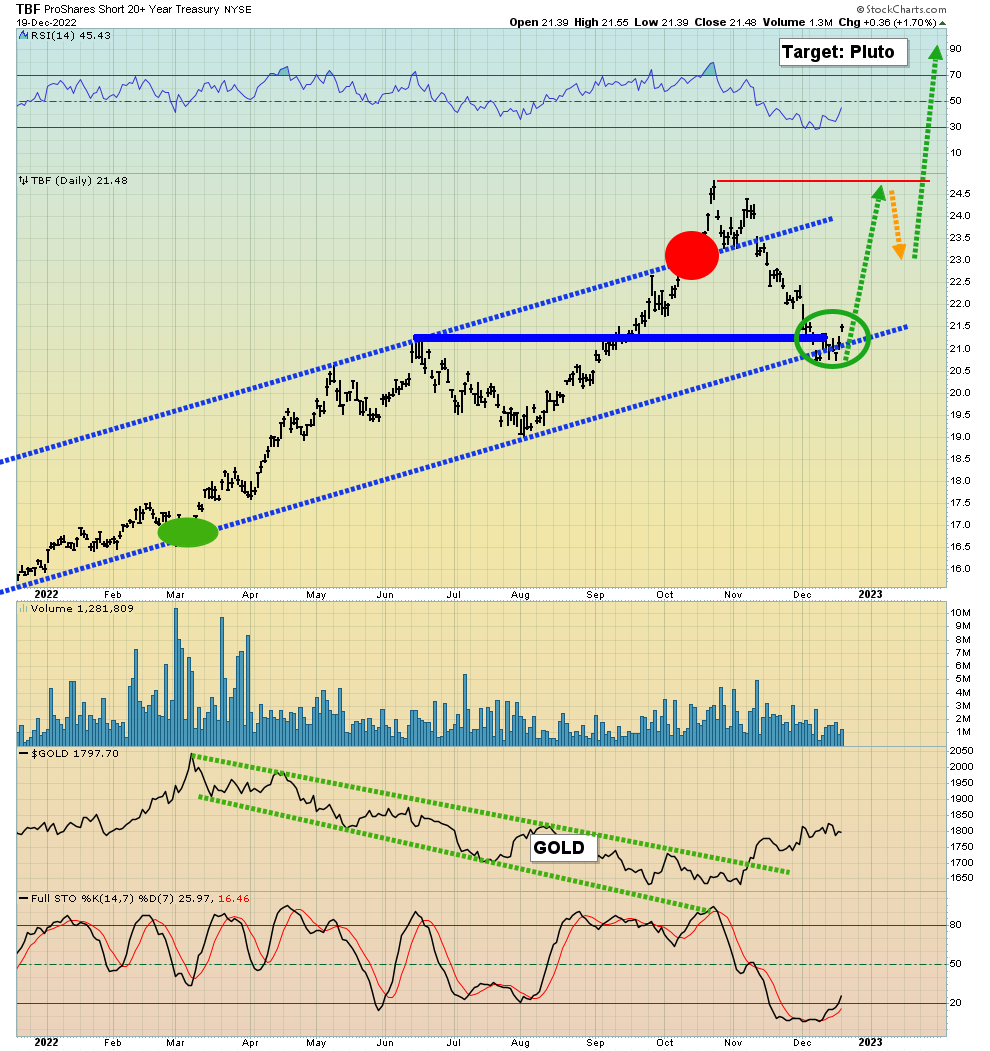
Is it time to re-enter bear bond plays like TBF and TBT? I think so.
Young gold bugs may need to “get with the stagflation and war cycle program” and understand that gold stocks go parabolic and get massive institutional support when inflation skyrockets and the central banks engage in panic hiking of rates. Here’s the bottom line on rates and gold:
A blinking and pivoting Fed is not needed to produce a parabolic move in gold, silver, and the miners. What’s needed is oil shooting above $130, USD:RUB skyrocketing, gold roaring above $2200, and the Fed going into panic mode.
The table is being set now, for that to happen. When the Fed panics, money managers will panic. They will sell the stock market much more aggressively than they sold it this year and then rush into the miners, creating a price parabola that makes the 1970s look like a tiny blip on a huge gold bull-era radar screen.
For most investors, an allocation of 40% gold, 40% fiat cash, and 20% stock market/miners are ideal, but many gold bugs like more aggressive posturing. The American fiat government’s biggest war-mongering failure makes this a time when the most aggressive gold bugs are likely poised to shine!
What about silver?
(Click on image to enlarge)
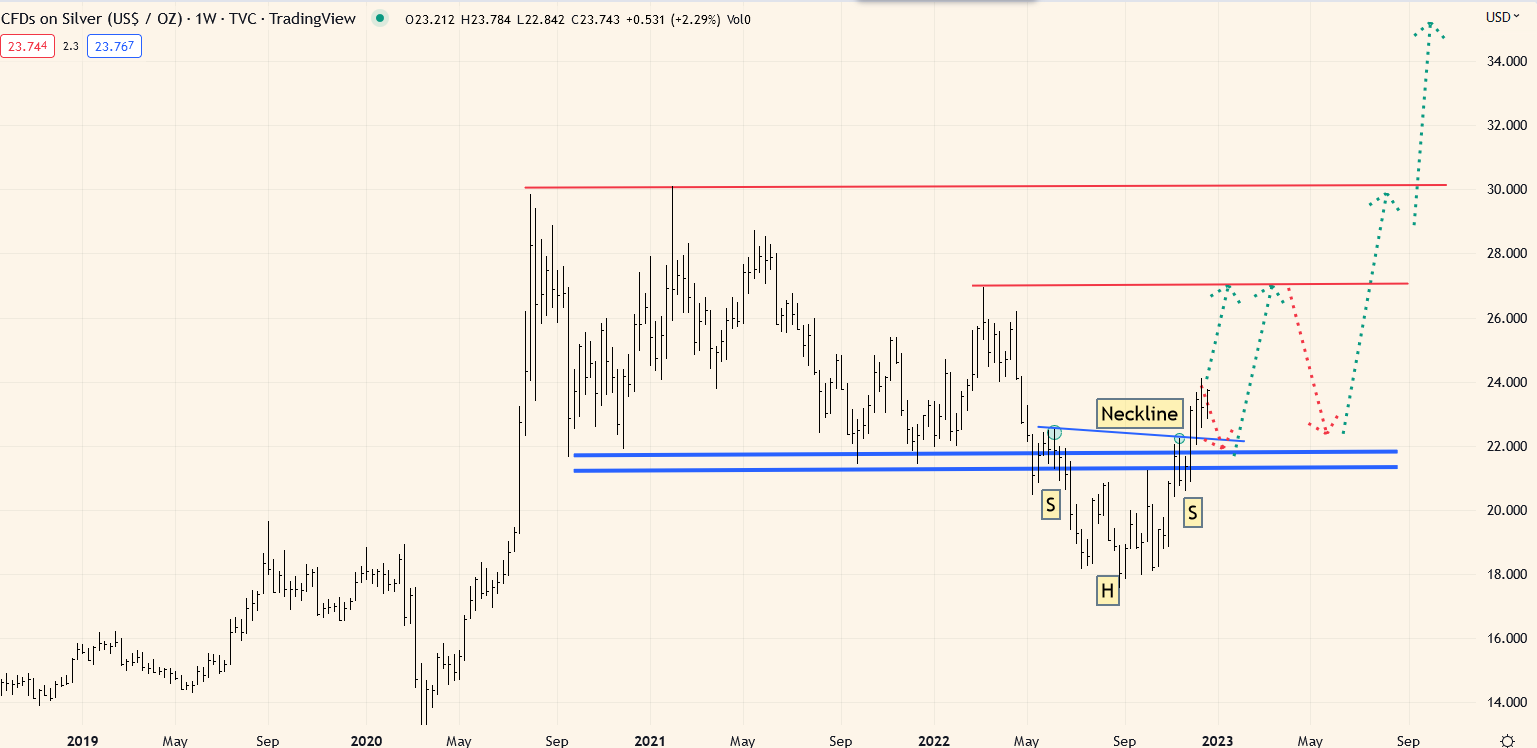
weekly silver chart.
While gold has stalled at its inverse H&S neckline ($1808), silver has surged through its neckline… and looks great.
The bad news is that silver is only half the price of its 1980 highs right now, and gold is double the price that it was then. The good news is that silver is the metal of middle earners and the poor when stagflation becomes persistent… and it’s set to become very persistent now.
Silver should surge to well above $50 by the end of the war cycle in 2025. The great news for silver bugs is that the end of the war cycle is only the beginning of “The Great Stagflation”. Here’s why:
Having failed in its wars and global meddling, the US government will find itself increasingly isolated due to a lack of trust from governments of the world…
A world that will be dominated by the gold-oriented citizens of China and even more so by the gold-obsessed citizens of India.
For the next several decades (and maybe longer) it’s going to be a commodity/metal stocks world for Western money managers who want to do well, and on that note:
(Click on image to enlarge)
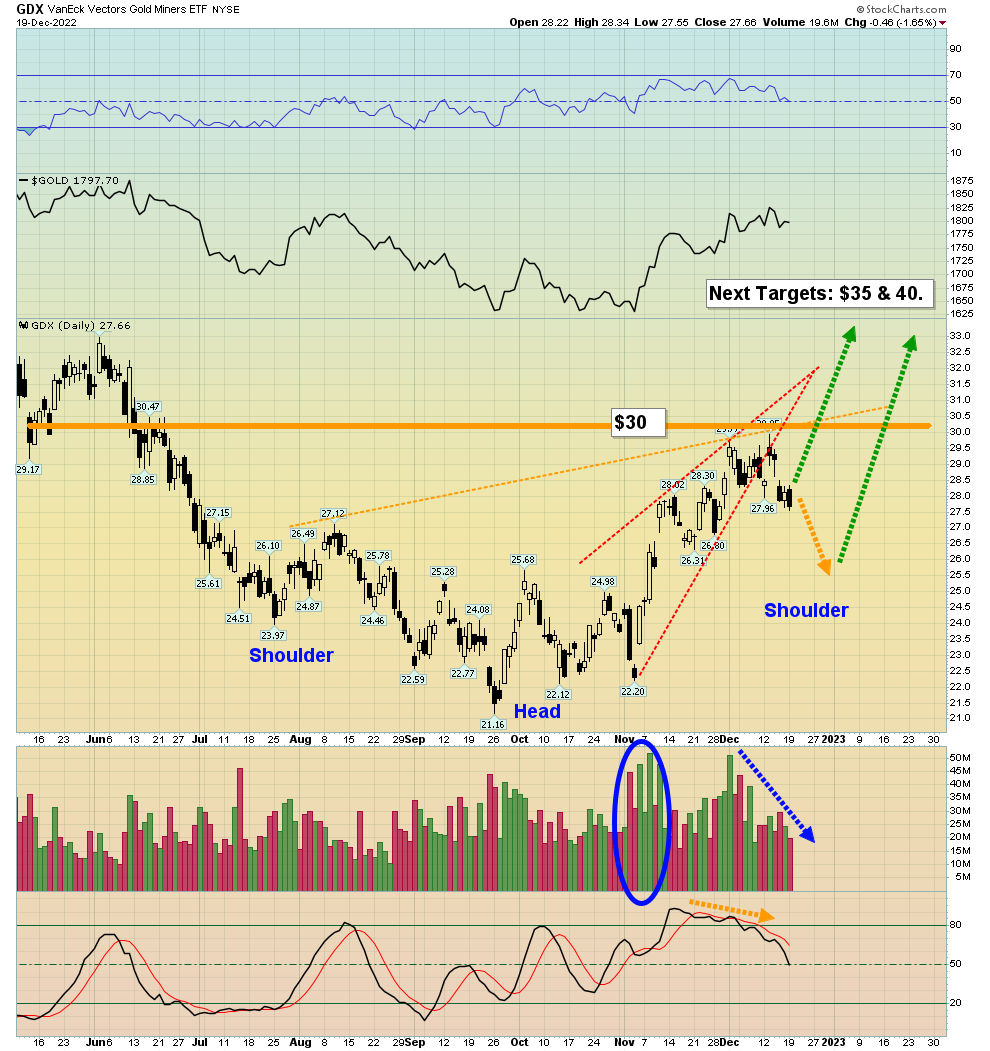
GDX daily chart
Note the positive volume pattern; as the price consolidates around resistance at $30, the volume has drifted lower. That’s bullish technical action.
(Click on image to enlarge)
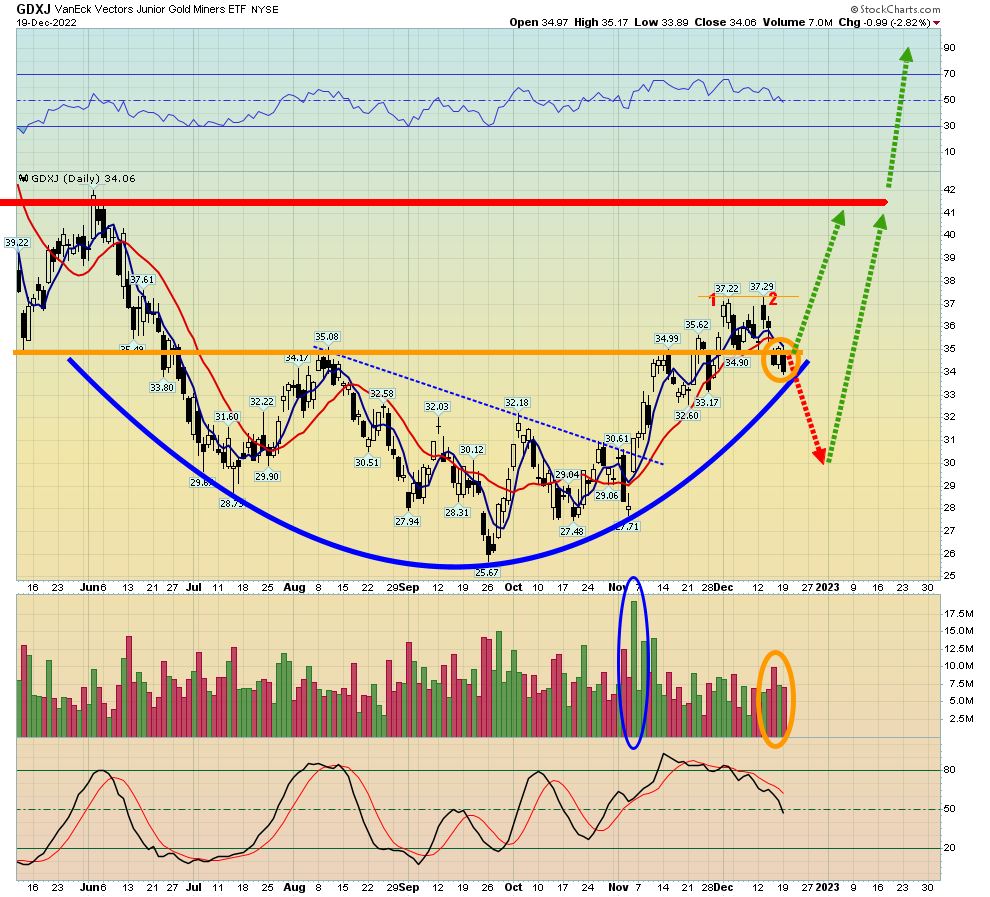
For GDXJ, a large base pattern is in play, targeting a run to $45 in the medium term.
GDX and GDXJ should both trade at hundreds of dollars per share as the war cycle peaks and transitions to a multi-decade “stagflationary bog”. All light weakness (meaning one to three-week pullbacks) in the miners can be bought by gold and silver stock enthusiasts… who are poised to grow exponentially in number!
More By This Author:
An Era Of Stagflation: Investor TacticsExciting Times: It's All About Gold
Gold Stocks & Gold A Bullish Divergence


