Electricity Won’t Save Us From Our Oil Problems
Almost everyone seems to believe that our energy problems are primarily oil-related. Electricity will save us.
I recently gave a talk to a group of IEEE electricity researchers (primarily engineers) about the current energy situation and how welcoming it is for new technologies. Needless to say, this group did not come with the standard mindset. They wanted to understand what the electricity situation really is. They are very aware that intermittent renewables, including wind and solar, present many challenges. They didn’t come with the preconceived notion that oil is the problem and electricity will save us.
It wasn’t until I sat down and looked at the electricity situation that I realized how worrying it really is. Intermittent wind and solar cannot stand on their own. They also cannot scale up to the necessary level in the required time period. Instead, the way they are added to the grid artificially depresses wholesale electricity prices, driving other forms of generation out of business. While intermittent wind and solar may sound sustainable, the way that they are added to the electric grid tends to push the overall electrical system toward collapse. They act like parasites on the system.
We end up with an electricity situation parallel to the chronic low-price problem we have for oil. Prices for producers, all along the electricity supply chain, fall too low. Of course, consumers don’t complain about this problem. The electricity system also becomes more fragile, as we depend to an ever greater extent on electricity supplies that may or may not be available at a reasonable price at a given point in time. The full extent of the problem doesn’t become apparent immediately, either. We end up with both the electrical and oil systems speeding in the direction of collapse, while most observers are saying, “But prices aren’t high. How can there possibly be a problem?”
Simply removing the subsidies that come from Production Tax Credits doesn’t fix the situation either. In one sense, the problem reflects a combination of many types of direct and indirect subsidies, including state mandates and the requirement that intermittent renewables be allowed to go first. In another sense, the problem is that, in a self-organizing economy, energy prices (including electricity prices) can only rise temporarily. The increase in energy prices is made possible by a growing debt bubble. At some point, this debt bubble collapses. Raising interest rates, as the US is doing now, is a good way of collapsing the debt bubble.
Furthermore, the subsidies for intermittent wind and solar discourage other innovation because they lead to terribly low wholesale prices for innovators to compete against, particularly in areas where hour by hour competitive rating is done. The ultimate problem is that if one type of electricity production is subsidized (even if in subtle ways), all electricity producers must be subsidized. Governments cannot possibly afford such widespread subsidies.
A PDF of my presentation can be found at this link: An Electricity Perspective on the Fragile State of the Economy. In this article, I offer some comments on these slides.
Slide 2.

Slide 3.

Slide 4.
We have all heard the story on Slide 4 so many times that few people stop to question whether the story is really true. My analysis suggests that it may be mostly wrong.
Slide 5.
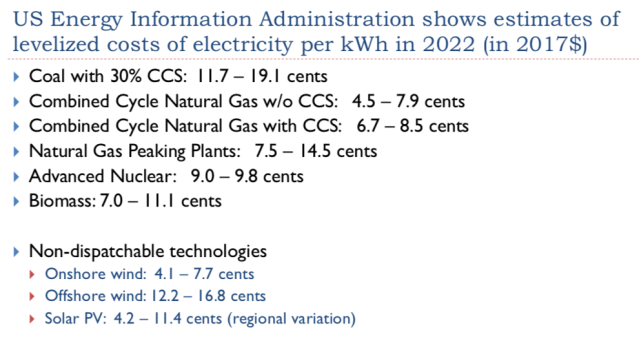
The big takeaway from this slide is that electricity companies planning for new generation should expect much higher electricity prices in the future. I discuss some of these items separately, on Slide 6.
By way of background, the US Energy Information Administration publishes “levelized cost of electricity” estimates that companies producing electricity are expected to use for planning purposes. When new generating capacity is added, planning needs to be started several years in advance. This is why what is being published now is the EIA’s calculation of expected wholesale costs (at a 2017 price level) for 2022.
Current wholesale prices for “dispatchable” electricity (the opposite of intermittent electricity) seem to be in the 3 to 4 cents per kWh range in the continental US, so all of the amounts shown assume that electricity prices will be much higher in the future. This thinking is in parallel with the “high oil prices will save the oil industry in the future” view that is prevalent in the oil industry. This thinking has helped keep the prices of shares of energy stocks up: “Even if there are problems now,” the thinking goes, “certainly higher prices in the future will fix the situation.”
CCS = Carbon Capture and Storage. CCS techniques are designed to remove a specified percentage of the CO2 generated when coal or natural gas is burned to provide electricity. The unwanted CO2 is stored underground. If the CO2 escapes, it can suffocate the population in the surrounding area. I would not make bets on the technique’s widespread adoption.
Slide 6.
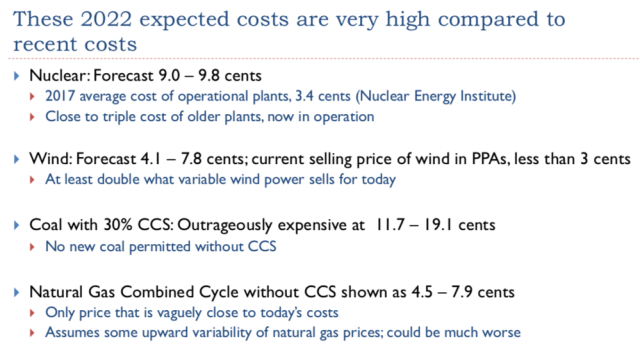
Slide 6 shows a wholesale cost comparison for some particular pieces from Slide 5. All of the costs shown are very high compared to current prices. Wholesale prices tend to be in the 3 to 4 cents per kWh range because of the low cost of fuel (2 to 3 cents per kWh) and the low cost of already built generation. With recent changes in regulations, new generation is expected to be very expensive.
With respect to wind, there are two reasons why variable wind can be sold in Power Purchasing Agreements (PPAs) for 2 to 3 cents per kWh. The first is the substantial subsidies that have been available, making this pricing arrangement profitable to wind producers. The second is the low value that intermittent electricity provides to the grid. In fact, prices locked into these PPAs are slightly below the bottom of the range of expected future natural gas prices (Figure 1, below). This suggests that the primary value of wind generation is to replace natural gas as a future fuel.

Figure 1. Median PPA prices compared to forecast future natural gas prices. Chart by Department of Energy (Chart 54) in its 2017 Wind Technologies Market Report.
Somehow, miraculously, the EIA forecasts that the value of this intermittent wind will rise to 4.1 – 7.8 cents per kWh. In Figure 1, above, this would compare to 41 to 78 $/MWh, which is above the forecast gas price range.
Slide 7.
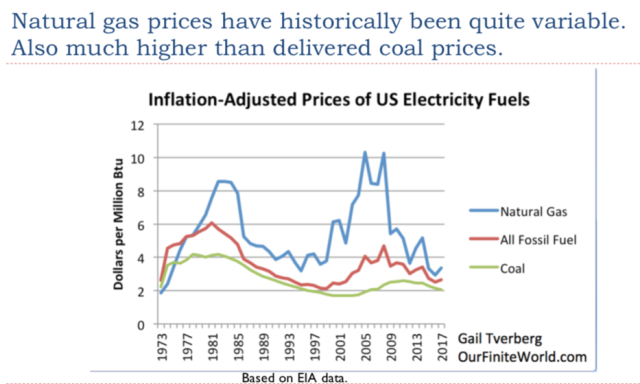
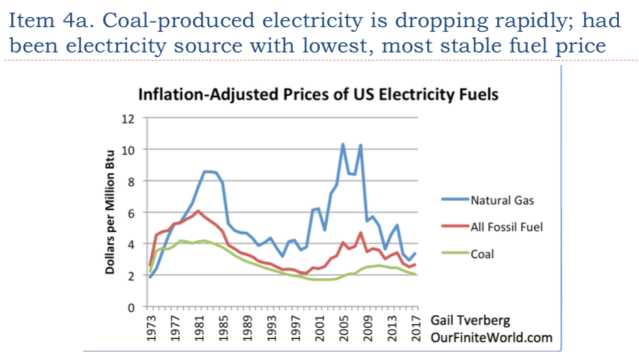
Notice how low and stable the green coal line is, compared to natural gas prices.
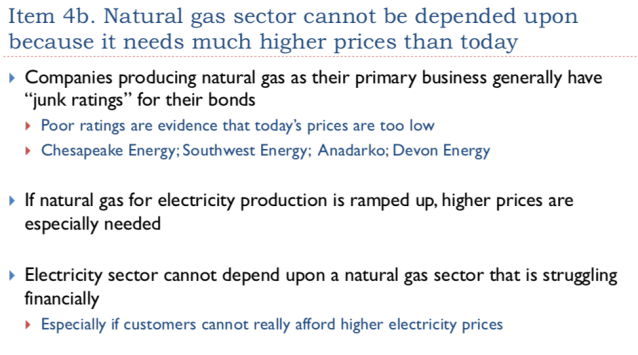
Natural gas comes from two types of producers: (1) those drilling specifically for natural gas, and (2) those drilling primarily for oil, and producing natural gas as a (mostly unwanted) low-value byproduct from drilling for oil. The second type of producer is willing to almost give away natural gas. If it becomes necessary to rely on production from companies whose primary focus is on natural gas production, prices will need to be higher.
Slide 8.
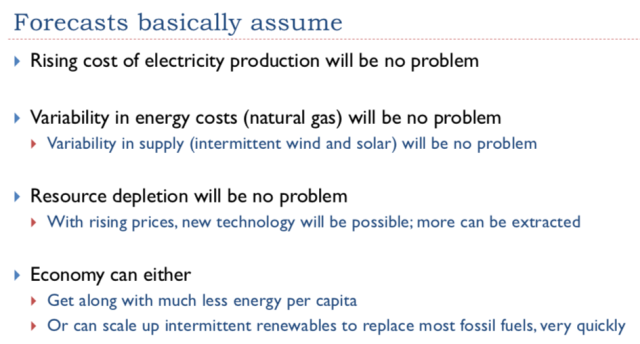
These are all very important assumptions that are not really true.
There is one reason why it might make sense to somewhat believe the first item, “Rising cost of electricity production will be no problem.” This has to do with the cost-plus type of electricity pricing (“regulated pricing”) that is used in some states of the United States. When cost-plus pricing is used, higher costs can, in theory, be passed on to consumers. The catch is that higher electricity prices tend to raise the price of finished goods and services. If wages are not rising rapidly enough, this can lead to an affordability problem. Industrial users of electricity are especially likely to cut back their electricity demand because higher prices make their products less competitive in the world economy.
After the talk, I decided to look at this situation a bit more closely. This analysis strongly suggests that since 2000, increased globalization has been playing a major role in holding down US demand for electricity. If there is an opportunity, industrial production will move to jurisdictions where the total cost of production (including wages, benefits, electricity costs, and other costs) is lower, even if there has not been a big increase in industrial electricity prices.
If we analyze US electricity consumption by type of user (Figure 2), we see that industrial electricity consumption rose rapidly until the late 1970s, plateaued between 1980 and 1999, and began falling in 2000. This pattern suggests that globalization is an issue. Early globalization sent US manufacturing to Western Europe and Japan. Later globalization sent manufacturing to lower-wage countries, predominantly coal-consuming countries of Asia.
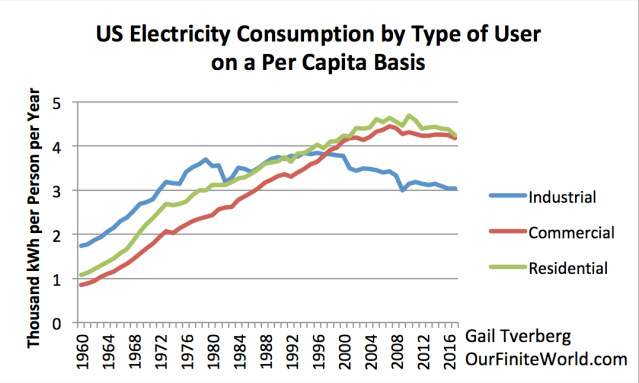
Figure 2. US Electricity Consumption Per Capita, by Type of User, based on EIA data.
US labor force participation rates started dropping about 2000, similar to the drop in industrial demand for electricity. Thus, in recent years, globalization seems to affecting residential consumers as well as industrial consumers. The impact on residential consumers is indirect, through job competition with global markets.
If analysts who estimate the required quantity of new generating capacity ignore the impact of globalization, their models are likely to give high estimates of the amount of new capacity to be added. If more generating capacity is added than is needed, it can be expected to push electricity prices downward, especially in competitive rating jurisdictions.

Slide 9.
As I will discuss later in this presentation, the economy operates based on the laws of physics. Because of this, it is impossible for the economy to change in ways that politicians would like.

Slide 10.

Slide 11.
Most of us have seen stories in the news about Macron and the Yellow Jackets. Can we really assume that citizens will accept higher carbon taxes, without protest?

Slide 12.
Industries get very unhappy when their electricity rates rise, making them uncompetitive with producers in other countries. The rates we are discussing are UK industrial electricity rates, so are a little higher (perhaps 1.5 times higher) than the wholesale prices discussed on Slides 5 and 6. If the price of 8.3 cents per kWh for industrial electricity is a big problem today, how can countries possibly withstand much higher rates, based on higher carbon prices or based on required technology that is much more expensive?
Slide 13.
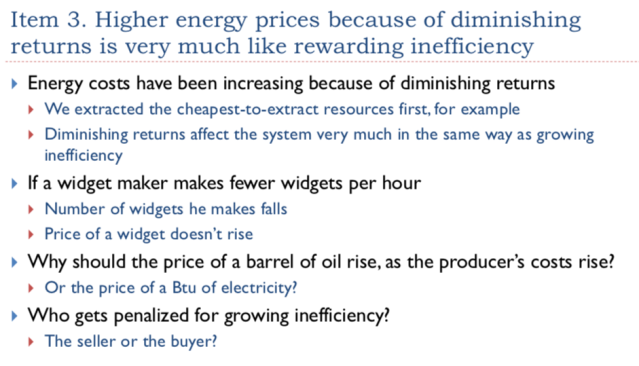
Suppose a worker gathers reeds and uses them to make baskets. If his production per hour falls, he will have fewer baskets to sell in the marketplace. He cannot expect the price of each basket to rise to make up for his lower production.
For some reason, economists seem to have overlooked this obvious problem. There is no reason to expect that the buyer will be penalized for the higher costs of the energy industry. These higher costs look much like growing inefficiency. In the real world, the seller is generally penalized for falling efficiency. Why do we have so much confidence that the price per barrel of oil can rise, or the price per kWh of electricity can rise, if the price of baskets that a less-efficient worker makes doesn’t rise?
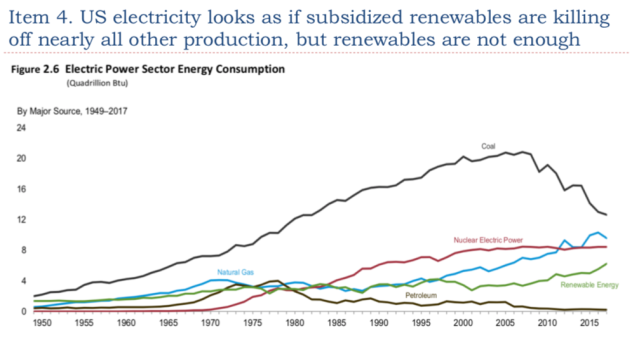
Slide 14. Chart by EIA. More detail on Renewable Energy available on Slide 18.
Slide 14 (made by the EIA) disturbs me. Coal production is dropping off rapidly, but the replacements we have are far from ideal.
Slide 15.
Coal (and nuclear) are the products that have historically kept US electricity prices low. Replacing coal with fuels that are much higher in cost and more variable in availability seems likely to be problematic. Industrial users are likely to be especially distressed.
Slide 16.
The United States has been fortunate enough to have very low natural gas prices recently. A major problem is that these prices are not really high enough for companies extracting natural gas as their primary business. If we really need to depend on natural gas, we will likely need much higher prices. In particular, natural gas prices will need to be high enough for natural gas companies to have bond ratings that are above junk ratings.
The question comes back to, “Can electricity prices really rise very much, without causing major problems?”
Slide 17.
Nuclear power represents a surprisingly large share of electricity generation. Slide 14 shows that in the US, its generation is higher than the sum of all types of renewables combined and almost as high as that produced by natural gas.
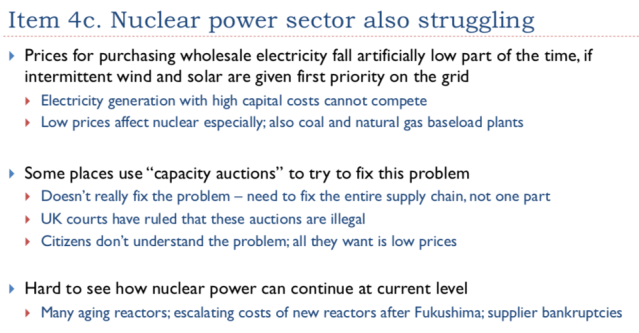
Yet nuclear has a lot of problems. It is perceived as dangerous (probably correctly so). Trying to correct the problems with being dangerous leads to a huge increase in the cost of new generation. Businesses in this field, such as Westinghouse, have gone bankrupt. The question of how to dispose of all the spent fuel is still a problem. Also, the many aging reactors will be difficult to replace.
There is also a problem with wholesale rates being too low for nuclear when electricity rates are competitively set. To work around this problem, some areas use capacity auctions, which are intended to offset the inadequate funding for electricity providers providing backup electricity capacity. One catch is that a capacity auction is, in some sense, needed for every member of the supply chain. Just asking electricity generating companies to bid on providing capacity doesn’t guarantee that the full supply chain will be available.
For example, for natural gas, the capacity auction bid would typically reflect the cost of adding new units for creating electricity from natural gas; such capacity is inexpensive. A more expensive part of the supply chain would be the cost of adding extra natural gas pipeline capacity that is used only a few days a year, when it is very cold or hot. Furthermore, natural gas providers need to be profitable enough to continue to obtain loans at reasonable interest rates. So, even if capacity auctions are provided, they aren’t designed to fix the problems of the whole supply chain.
Furthermore, there has been a recent court ruling that these capacity payments are illegal. I mention in Slide 17 that the UK is affected. In fact, it is the entire European Union that is affected by this ruling. So, even with the best of intentions, member countries of the European Union cannot collect capacity charges to try to offset the underfunding problems caused by giving intermittent renewables grid priority and other subsidies.

Slide 18.
Slide 18 shows that in the US, the only types of renewable generation growing to any significant extent are intermittent wind and solar. Very high subsidies have helped push these types of generation along.
Parts of these subsidies are being phased out, but other, less visible subsidies remain. The fact that intermittent wind and solar are given priority on the grid when they happen to be available, is a huge subsidy. Also, renewable mandates mean that generation is being added that is not really needed, lowering prices that the self-organizing competitive pricing system creates for backup electricity providers. This is part of the reason for the unprofitability of many natural gas, coal, and nuclear companies.

Slide 19.
In order for intermittent wind and solar to truly be dispatchable, the way other electricity providers are, there needs to be long-term storage for intermittent providers. A big part of the problem is seasonal matching of generation. For example, in a northern area, the main need may be for heat in winter, while intermittent generation may occur primarily in summer. Somehow, the variable wind/solar will need to be stored from summer to winter.
A post by Roger Andrews gives an idea of what the cost of the battery backup needed to solve this seasonal matching problem would be. His calculations indicate that adding sufficient batteries for seasonal matching can be expected to raise generation costs by more than an order of magnitude.

Slide 20.

Slide 21.
Most of the things we associate with rising energy consumption per capita are things we associate with a growing economy. Most people want these things.
Slide 22.
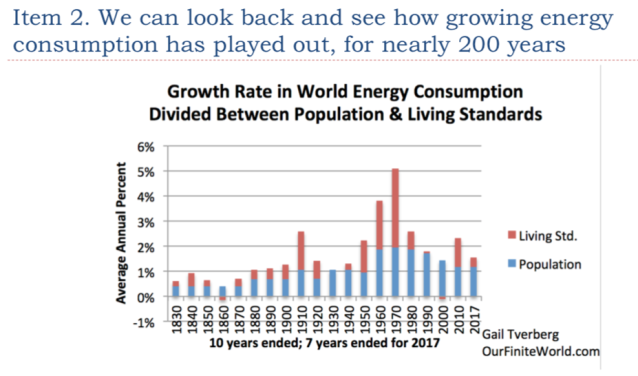
Slide 22 shows amounts I calculated from information various published sources. These include energy consumption estimates by Vaclav Smil in Energy Transitions: History, Requirements and Prospects for older years and BP Statistical Review of World Energy amounts for more recent years. Population estimates are by Angus Maddison.
Based on this slide, most of the growth in world energy consumption ends up being reflected as population growth. It is only when energy consumption growth is very high that the living standards portion (in other words, the energy consumption per capita portion) grows very much.
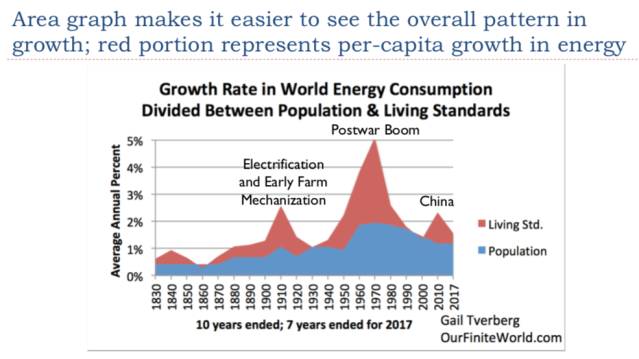
Slide 23.
The big economic growth bulges that the world economy has experienced are easy to see on Slide 23. One of these is centered around 1910; another is centered around 1970. A third, smaller bulge is centered around 2010; it already seems to be disappearing. This growth bulge was made possible by China and other Asian countries as they ramped up coal production. Now, this growth in Asian coal supplies is fading.
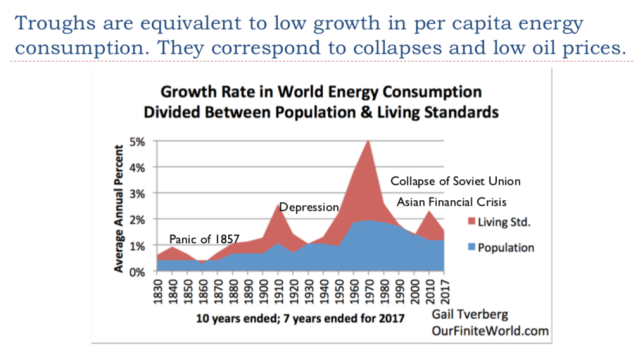
Slide 24.
The troughs, where the growth in per capita energy consumption falls to zero or slightly below, represent major problem times for the world economy.
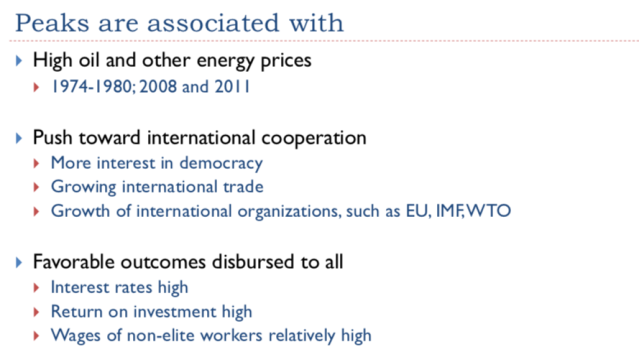
Slide 25.
When a person looks back, the times when oil prices were high (1974-1980, 2008 and 2011) were near energy consumption per capita growth peaks. They were in times of high energy supply, not low. Many favorable outcomes occurred at peak times, including increased cooperation and higher returns on investments.
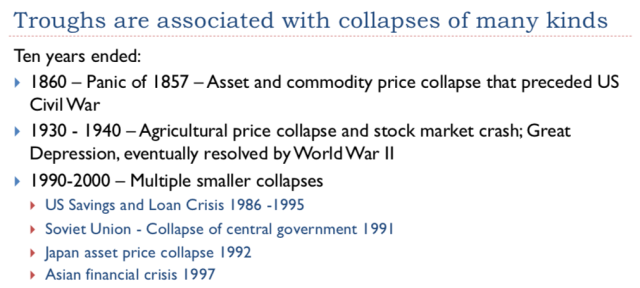
Slide 26.
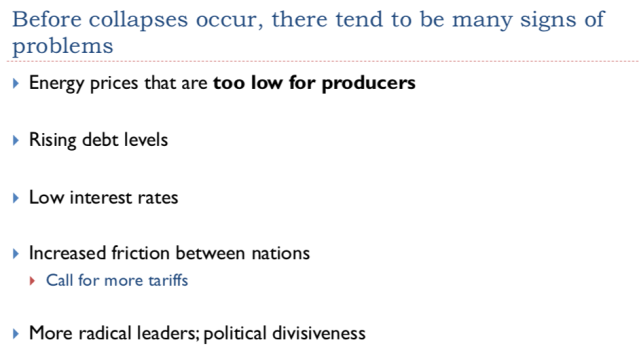
Collapses of all kinds occur near troughs in energy prices. Often, these collapses are followed by wars that might be interpreted as resource wars.
Slide 27.
Many of these signs are ones we have been seeing lately. There were calls for tariffs before the US Civil War. Tariffs were increased in the 1920s, to try reduce competition from abroad. Limits were also placed on immigration during the 1920s.

Slide 28.
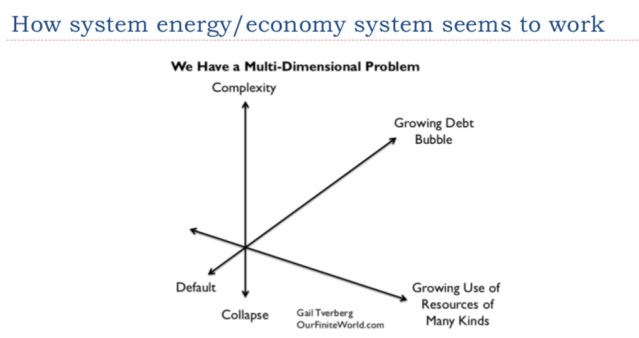
When I talk about a vector, I am talking about a combination (really, a weighted average) of many different kinds of somewhat similar inputs. Thus, the energy vector reflects the combination of energy of many types, including human labor sold as labor, in a particular economy. The complexity vector represents the many types of specialization and growing complexity that allows resources (including energy resources) to be used by the economy. The debt vector indirectly represents promises of future goods and services made with energy products. Much of the debt vector needs to be repaid with interest. If the economy is growing rapidly, this is not difficult. If the economy is stagnant, this becomes a problem.
Many people think that oil or crude oil has a particular significance. I see the economy operating as an overall whole. Each machine needs to have the particular fuel it uses. Companies decide to build factories in a particular part of the world based on an area’s overall cost level and the stability of its supplies, not based on the price of a single fuel.
Slide 29.
Slide 29 shows my view of how the economy works. As long as the debt level is growing rapidly enough, commodity price levels can be bid up to a high level, allowing increasingly complex goods and services to be produced, using an increasingly complex delivery system. At some point, the increasingly complex system for producing goods and services produces an excessive amount of wage disparity. About the same time, the cost of production tends to rise, as diminishing returns becomes an increasing problem.
The combination of rising production costs and an increasing share of the population with low wages soon creates a variety of problems. The economy tends to grow too slowly, so that debt cannot be repaid with interest. At the same time, the increasingly impoverished non-elite workers cut back on the goods and services they purchase. This might happen if young people find that they need to live with their parents longer, for example.
If interest rates are raised, this speeds up the failure of the system. Eventually, the economy, or a major portion of the economy, tends to collapse.
The big issue that tends to bring an end to economies is the increasing wage and wealth disparity that comes with growing complexity. As long as everyone is fairly equal, no one is squeezed out of buying goods such as homes, vehicles, and other expensive purchases. As businesses and governments get larger and more hierarchical, an increasing share of workers find themselves with low wages. These low wages adversely affect the economy in many ways:
- It becomes difficult for governments to collect enough taxes.
- Demand for commodities (such as those used to make homes and vehicles) tends to fall too low, leading to low prices for commodities.
- Overthrown governments become more common.
- Low-wage individuals become susceptible to epidemics because they do not eat well.
Slide 31.
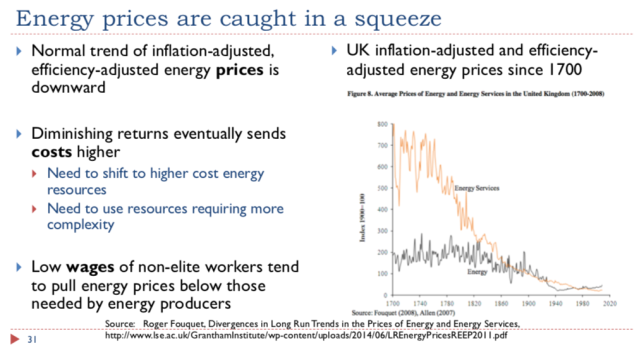
The orange Energy Services line in the chart at the right shows the UK’s trend in the price of energy services since 1700, on an inflation-adjusted, efficiency-adjusted basis. The trend in these prices has been almost continuously downward. As long as the cost of energy services is downward, it is possible to add increasing amounts of these energy services, because they become ever more affordable. These energy services allow more goods and services to be produced. This seems to be a major factor underlying economic growth.
Diminishing returns, with a resulting increase in the cost of energy services, tends to be the “spoiler” in this system. In theory, rising complexity can be used to work around these higher costs. In fact, increasing complexity is helpful for a time. Eventually, however, the growing wage and wealth disparity that comes with increasing complexity tends to bring the system down. With the growing complexity, the system no longer has enough high-wage workers who can afford the finished products that the system creates. The many low-wage workers cannot make up for this lack of affordability. The number of new homes and new vehicles sold begins to fall, as a result.

Slide 32.
Interest rates, as well as the debt that is available because of low-interest rates, play a surprisingly large role in commodity prices. The issue seems to be that debt is used to finance most large purchases, such as factories, schools, homes, and vehicles. If interest rates are low, it is possible for consumers to afford many more of these large purchases than they could otherwise. Once interest rates rise, the entire economy tends to shrink back. Debt bubbles tend to collapse.

Slide 33.

Slide 34.
Research into complex systems that seem to grow without outside help is a fairly new field. Clearly, the economy is such a system. New businesses are added, as individuals see the need for a new product and a way of producing that product in a way that consumers can afford it. New consumers are added over time, as young people grow older and set up their own homes. Governments gradually add laws to regulate the system. Taxes are an important part of the system as well, and tax laws also change over time.
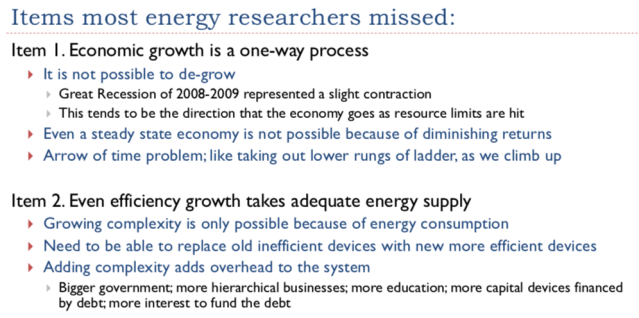
The thing that people don’t stop to think about is the fact that the system cannot really go backward. If a product is no longer needed (buggy whips, for example, for horse-drawn carriages), it will no longer be produced. So, the situation is a little like removing the lower rungs of a ladder, as a person climbs up the ladder. This inability to go backward makes it difficult to adapt to falling supplies of any kind of commodity, including energy commodities.

Slide 35.
The vast majority of researchers do not understand the important role that energy plays in operating the economy and making it grow. These self-organizing systems (dissipative structures) absolutely depend on energy consumption. In fact, economies seem to depend upon increasing energy consumption per capita.
At some point, all dissipative structures (including hurricanes, plants and animals, economies and many others) come to an end. This is the way that a finite world can keep adapting and changing. New dissipative structures form and indirectly take the place of the previous dissipative structures. These new structures vary in structure from the previous dissipative structures. If the new structures are not well adapted, they quickly collapse, allowing room for yet other dissipative structures to form. The replacement of economies in this manner acts as a form of evolution, just as plants and animals evolve.
Slide 36.
Researchers tend to create models that fit their own preconceived notions of how the economy should work. This approach, plus the peer review process, tends to produce a lot of papers with the same (often wrong) assumptions.
Slide 37.
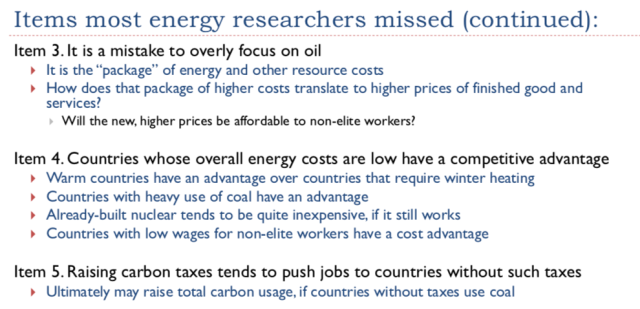
These should be fairly self-explanatory.

Slide 38.
This is probably the most important reason that economies tend to collapse. Most people miss the affordability connection because they interpret “Demand” to be something that anyone can do, without thinking about the affordability aspect. Without sufficient income, a person cannot demand a new home or new car, or gasoline from a fuel station.
Slide 39.
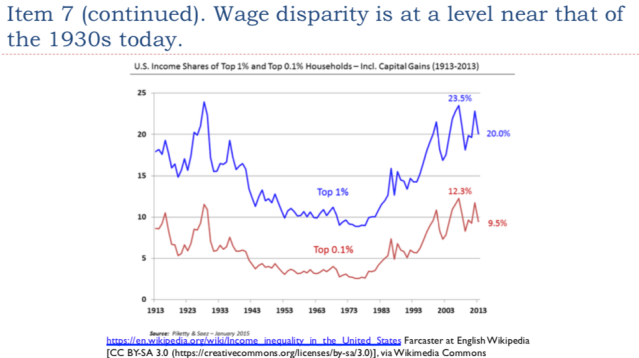
There have been many articles written in recent years about growing wage and wealth disparity. In fact, in the US, wage disparity seems to be back at the level it was before the Great Depression of the 1930s.

Slide 40.
Slide 40 tries to explain a paradox. Energy prices don’t really rise, as production falls too low. Instead, the complex system behaves in a strange way, causing commodity prices to fall because of the growing wage disparity and debt bubble collapses.
One way of understanding the situation is by understanding that energy consumption is required for jobs that pay well. If insufficient energy supplies are available at a low price, the vast majority of jobs available will be low-paid service jobs. There will, of course, be a few managers and business owners. But these few managers and owners cannot, by themselves, generate enough Demand for goods and services made with energy products to keep commodity prices up. This is why the system tends to fail.
Slide 41.
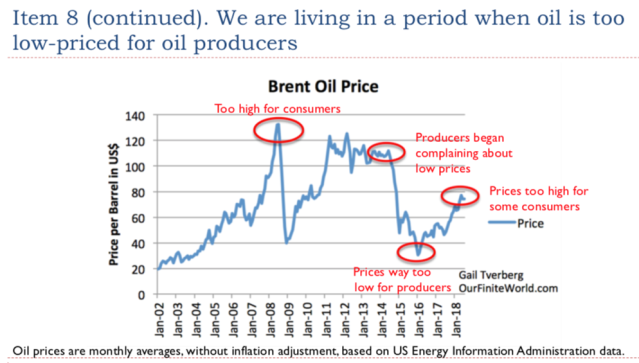
I have been following oil since 2005, so I have had a chance to hear the discussion evolve. Oil prices were clearly too high for some consumers back in July 2008, when the sub-prime housing debt bubble popped in the United States. By early 2014, I started hearing that oil companies were very unhappy about the low price level available in 2013. In fact, some companies were sufficiently unhappy that they began cutting back on investment in new fields. It was not much later that oil prices dropped further, making the low-price problem even worse for producers.
Slide 42.
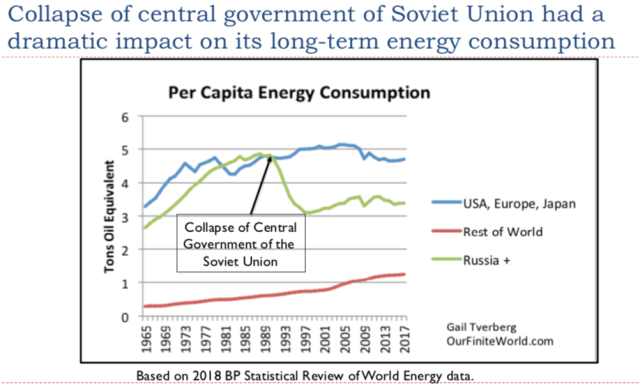
It is surprising how large and long-lasting an impact the collapse of the central government of the Soviet Union in 1991 had on its long-term energy consumption. The collapse wiped out a large share of the industry of the Soviet Union and its close affiliates. The Soviet Union was an oil exporter, so the low oil prices of the 1980s were one reason for its collapse. Prices were not high enough for adequate reinvestment in new fields.
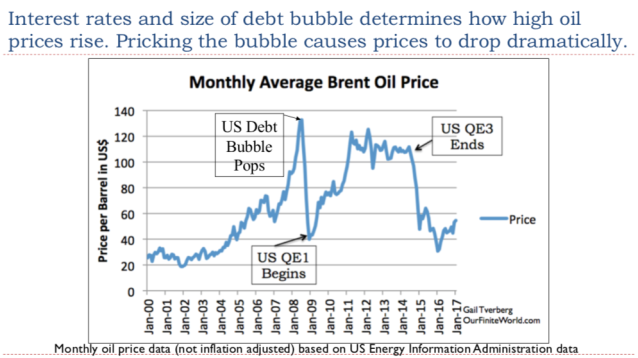
Slide 43.
One common inaccurate assumption is that oil prices rise primarily in response to the rising cost of oil production. If a person looks at the data, it becomes clear that interest rates have a huge impact on prices. This seems to happen because the purchase of high-value goods with debt (such as factories, homes, cars, and buildings of all kinds) seems to have a very significant impact on total Demand. Lower interest rates make these high-value goods more affordable. (Quantitative Easing (QE) is a way of reducing long-term interest rates; it also seems to affect oil prices.)

Slide 44.
Since I made up this list, I can add another model to the list that seems to be wrong. The Human and Nature Dynamics (HANDY) model of Safa Motesharrei gives an inaccurate assessment of the likely future path of the economy because it leaves out both diminishing returns and long-term population growth.
In every case, the researchers put together models that represent only a part of the way the world’s self-organizing economy actually works. They pick out a few aspects that they think are important, but they miss other important aspects. This selection significantly affects the outcomes predicted by their models.
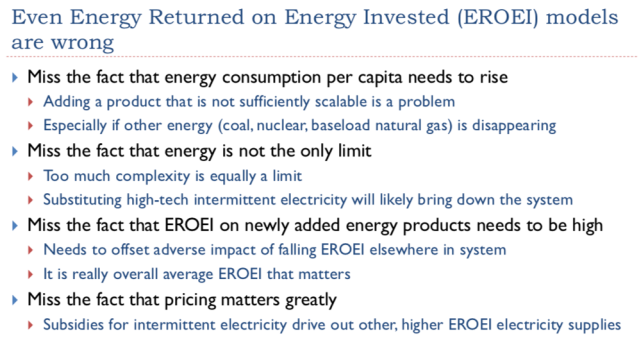
Slide 45.
Some readers may be familiar with the Energy Returned on Energy Invested (EROEI) model. This is a model that is sometimes used to justify the reasonableness of selecting certain substitutes for oil, such as the use of intermittent wind and solar. As with all of the other models, the model gets some things right, but it also gets a lot of things wrong. Without understanding how the economic system really works, it is hard to see what goes wrong with the model.

Slide 46.
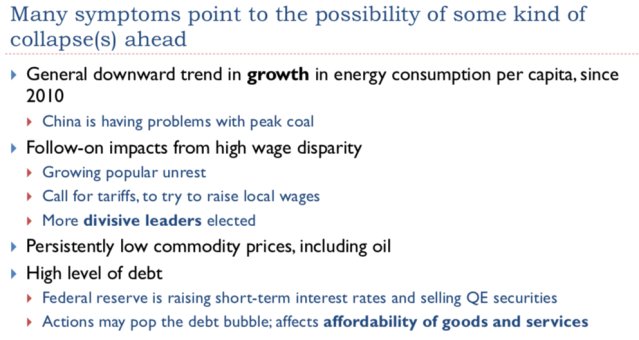
Slide 47.
These are all disturbing signs.

Slide 48.
World leaders act in ways that they feel that those who vote for them would like. In some sense, they are trying to save their own part of the world, even if they create increasing problems elsewhere.
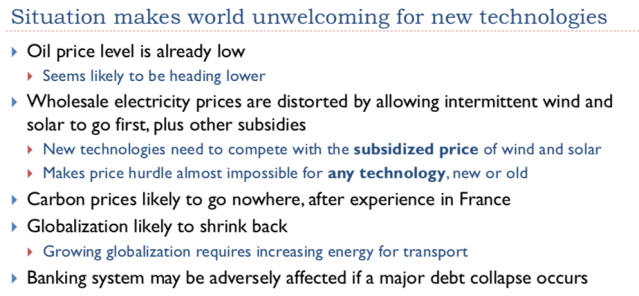
Slide 49.
It is difficult for any new technology to get a foothold in a situation where energy prices of all kinds tend to be low. In addition, the pressure seems to be in the direction of reducing energy prices further, even if this means less energy production of all kinds.
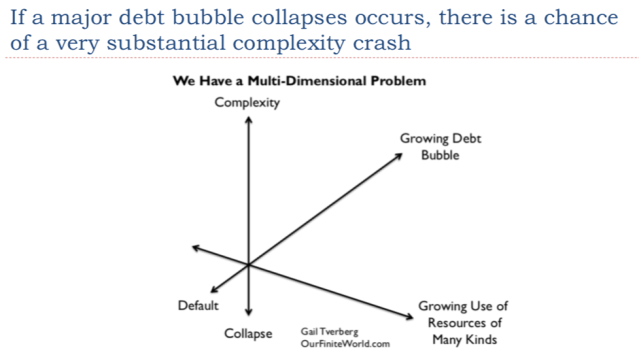
Slide 50.
The world has become increasingly globalized in the last thirty years. Because of the greater interconnectedness, if a collapse occurs in the near future, it could be much worse and more widespread than prior collapses. The adverse results could exceed those of the Depression of the 1930s or the Great Recession of 2008-2009. We have no guarantee of being able to preserve either the oil system or the electricity system. The population of the world could fall dramatically; the economy may need to organize again in a new way without either oil or electricity. We live in interesting times.
Disclosure: None.


It is funny that natural resource energy from solar and wind farms actually encourage the use of fuel as back up power because it can be turned on and off faster and more efficiently than nuclear, water, and giant generators built by burning other things like coal. Likewise electric cars that require short term use of energy also encourages this power generation. Thus, we really have a growing need for oil driven power with most "clean energy solutions". This is ironic although most people are unaware of the end results of their clean energy drives without thinking through the whole issue.
In the end, if you want to help the environment you must cut your energy use. Most other things just tend to displace your carbon footprint not decrease it. As we can see with France's protests. Doing this is not popular in the least and the ones with the biggest footprint are actually the wealthy including those who are so gung ho on electric cars and solar panels. Their footprint is often over 100% greater than the magnitude of a guy living in a 3 bedroom house with a family driving a Humvee. How? Heating and cooling a giant house. Flying her and there (travel and vacations). and consumption (especially if most things you buy are made elsewhere). It all adds up. Especially if you include construction, services, and transportation.
We need a rational discussion on global energy use. Right now most of this stuff is piecemeal and largely tokenism. I enjoy this author's discussions on energy. They are worth the the read even if you disagree with her.
Ms. Tverberg has presented well researched information and put forward some strong opinions. The whole Electricity issue is of concern for Americans, not most Canadians. The Canadian infrastructure and landscape for generating electricity is more favorable in the major Canadian provinces, Quebec and Ontario. Both provinces sell electricity into the grids of the Northern states, especially the State of New York. A concept that is not easily accepted by some Americans is the "nationalization" of electrical power resources. This concept, albeit has caused large government deficits, but cheaper electrical power for hungry industry and consumers. Canadians subsidized the development of solar and wind, a return that will likely not come back. Despite all of the theories, the future for North American electricity will likely be Natural Gas. Just saying.
THIS POST IS BOTH EDUCATIONAL AND QUITE DISTURBING. Most of the predictions are unpleasant and quite unhappy as well. While I would be able to live by my wits and selling my skill sets, I am an age where that would not be fun. And watching things fall apart is never fun, even when it is enemy forces doing it. The disturbing part is that the evidence presented is certainly believable.