
Did The “Powell Put” Change Anything?
On Friday, I discussed the market surge on Wednesday following comments from Fed Chair Jerome Powell:
“All it took was two 10% stock market corrections in a single year and some heavy ‘browbeating’ from President Trump to reverse Jerome Powell’s hawkish stance on hiking interest rates.
On Wednesday, Powell took to the microphone to give the markets what they have been longing for – the ‘Powell Put.’ During his speech, Powell took to a different tone than seen previously and specifically when he stated that current rates are ‘just below’ the range of estimates for a ‘neutral rate.’ This is a sharply different tone than seen previously when he suggested that a ‘neutral rate was still a long way off.’
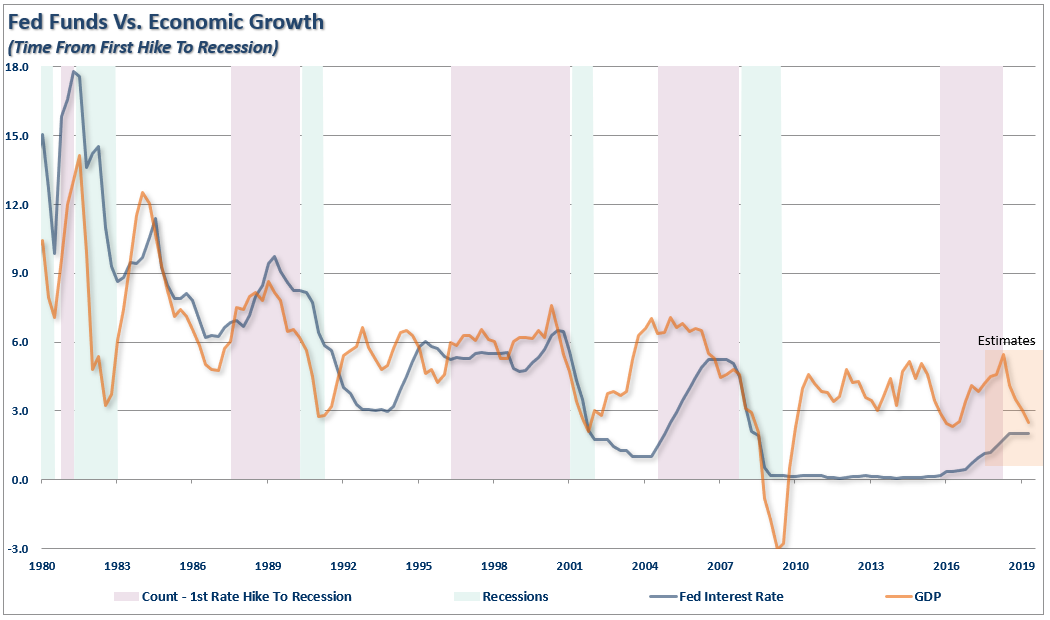
Importantly, while the market surged higher after the comments on the suggestion the Fed was close to ‘being done’ hiking rates, it also suggests the outlook for inflation and economic growth has fallen. With the Fed Funds rate running at near 2%, if the Fed now believes such is close to a ‘neutral rate,’ it would suggest that expectations of economic growth will slow in the quarters ahead from nearly 6.0% in Q2 of 2018 to roughly 2.5% in 2019.”
This weekend, Presidents Trump and Xi are going to the table to discuss trade and tariffs. While I don’t expect much to actually come from the meeting, I would expect some smiles and handshaking between the two with some positive overtones on “progress being made.”
Regardless of the fact the outcome will have “no teeth” to it, and will ultimately wind up back in a trade dispute over “technology rights” before long, it should be enough to rally the bulls in the short-term.
However, I agree with Goldman Sachs assessment on Friday via Zerohedge:
“Goldman writes that it sees three basic scenarios for what happens after this weekend.
- The first and in Goldman’s view most likely outcome is continuing on the current path of ‘escalation’— tariff rates rise to 25% on all imports currently under tariff, and tariffs are extended to remaining Chinese imports.
- A close second is a ‘pause’, where existing tariffs remain in place but the two sides agree to keep talking with escalation put on hold.
- A ‘deal’, which Goldman thinks is unlikely in the near term, would involve complete rollback of the current tariffs.
The reason why Goldman is surprisingly pessimistic on the outcome is because there has been a growing sense among US policymakers that China has benefited disproportionately from the bilateral economic relationship, effectively supporting a hard-line stance against Beijing.”
While Goldman is leaning more towards an “escalation", President Trump has staked his entire Presidential career to the stock market as a measure of his success and failure.
If President Trump was heading into the meeting this weekend with the market at record highs, I think a “hard-line” stance on China would indeed be the outcome. However, after a bruising couple of months, it is quite possible China will see an opportunity to take advantage of a beleaguered Trump to keep negotiations moving forward.
This is also particularly the case since the House was lost to the Democrats in the mid-term. This is an issue not lost on China’s leadership either. With the President in a much weaker position, and his second tax cut now “DOA,” there is little likelihood of any major policy victories over the next two years. Therefore, the risk to the Trump Administration is continuing to fight a “trade war” he can’t win anyway at the risk of crippling the economy and losing the next election.
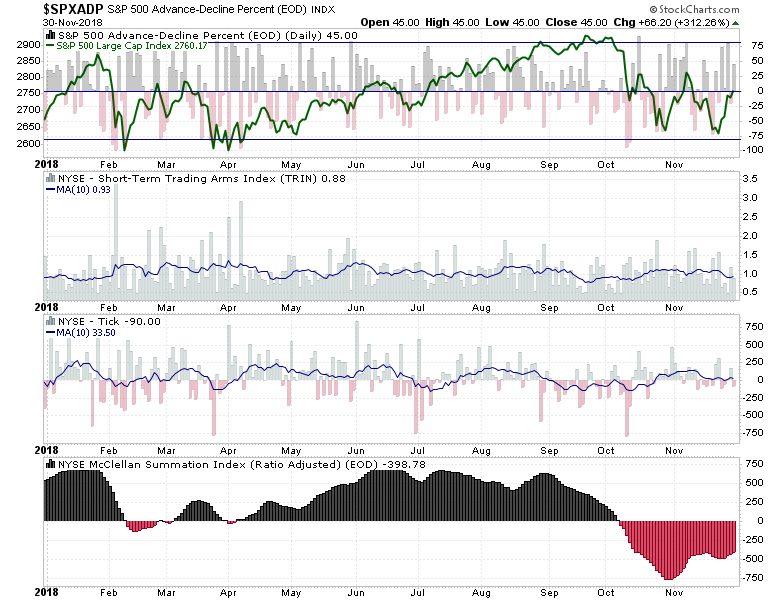
But moving to the technical picture, other than the “one day” super rally, much like we saw immediately following the elections in November, the underlying breadth and technical backdrop has not improved much. The chart below shows the Advance-Decline Percent, TRIN, TICK and McClellan Summation Index all of which have failed to show the improvement needed to establish a bottom has been put into place.
However, with that said, the market did reach extremely oversold levels during the October/November correction which provided the necessary “fuel” for a short-term rally. However, as shown below, the impending “resistance” from both the 50- and 200-dma will likely prove to be a fairly formidable obstacle for the markets to breach in the near-term.
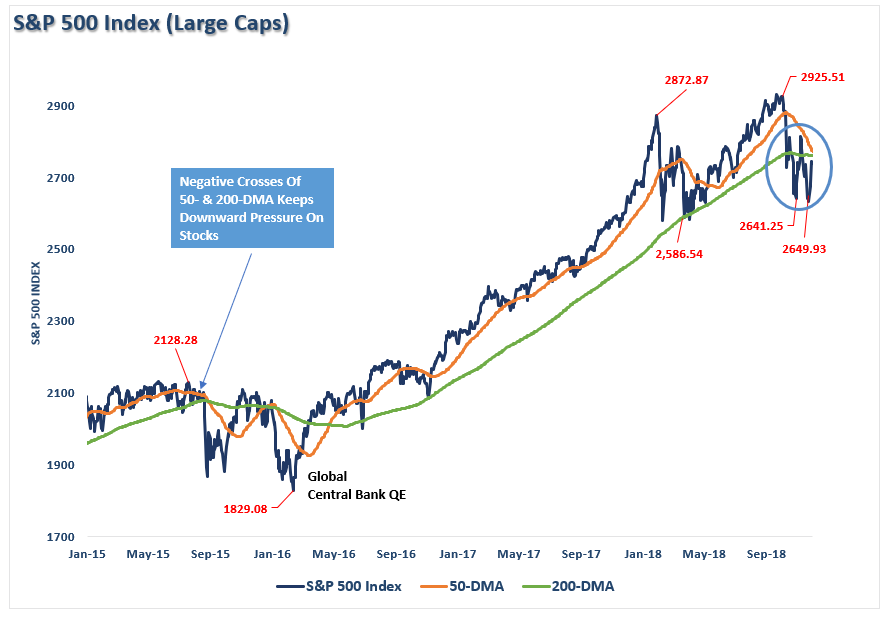
However, notice that in 2015 the market did briefly break above the 50-dma just before the crossover occurred which dragged prices back down with it. The trend of the market is still negative currently, so risk remains to the downside for now. As Victor Dergunov penned last week, the headwinds to the market continue to mount.
- Former leaders are now laggards and are overwhelmingly in deep bear market territory.
- Many sectors are approaching bear market declines.
- Defensive sectors such as consumer staples, healthcare, real estate, and others are outperforming.
- Utility, staples, and real estate stocks are experiencing heavy demand and are behaving much differently than in the prior correction.
- Valuations are still extremely high.
- SPY would need to decline by 33% just to reduce valuations to long-term historical median average.
- Corporate earnings may peak as soon as early to mid-next year.
- Debt levels are extreme and are becoming increasingly difficult to manage and service.
- Future credit is becoming more expensive and more difficult to come by, which is slowing ,economic growth.
- The Fed’s unsupportive policy is putting enormous pressure on asset prices, threatening to deflate multiple bubbles.
- Stocks don’t necessarily need a recession to go into a bear market. Nevertheless, bear markets almost always precede peak earnings and recessionary environments.
With the Fed out of the way until mid-December, the focus for the markets will be any hint of a “roll back” on Trump’s positioning with respect to China, trade, and tariffs.
After having reduced equity risk a couple of weeks ago, we are looking for opportunities as they present themselves. However, for the most part, our bond positions have continued to carry the bulk of the load as of late.
Daily View
The rally over the past few days has virtually exhausted a bulk of the “oversold” condition which previously existed. While such doesn’t mean the market can’t move higher, it simply suggests that most of the “fuel” available for a rally has been utilized. With the markets still on a “sell signal” currently, and below major points of resistance, remaining a bit cautious until the underlying technical backdrop improves seems prudent.
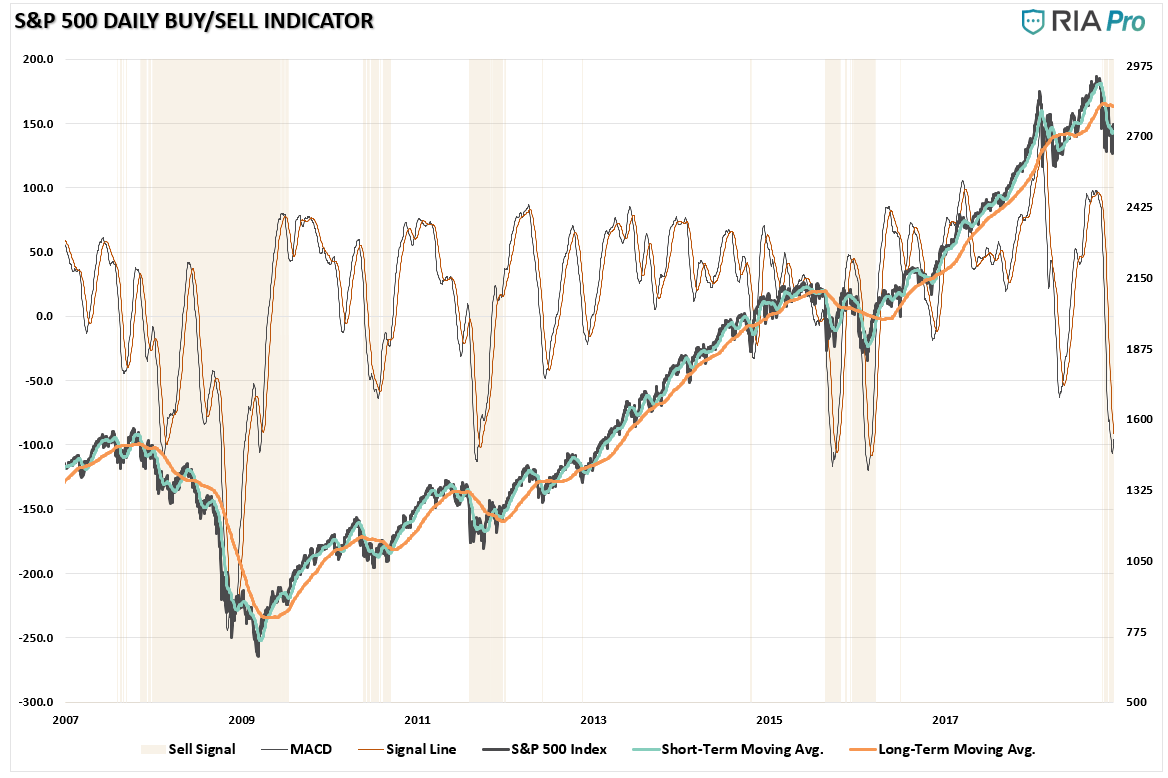
Action: After reducing exposure in portfolios previously, and portfolios much heavier in cash currently, we will sit with our winners and core positions and allow the markets time to figure out what it wants to do next.
Weekly View
On a weekly basis, the story remains much the same. With a sell signal registered for only the seventh time in the past two decades, we will just allow the markets to figure out what they want to do before getting more aggressive. The recent violations of long-term moving averages suggest a change in market conditions that should not be dismissed. However, should the market improve, and ultimately reverse the relative “sell signals", we will gladly increase exposure back to target weights.
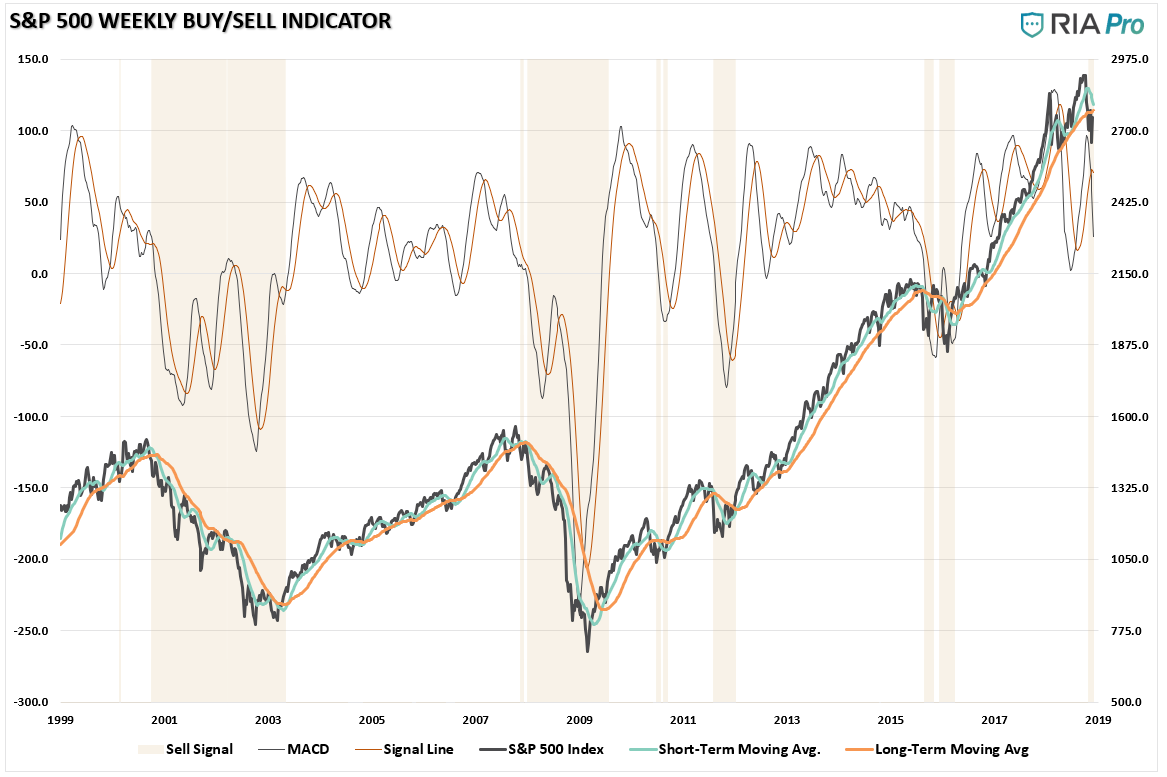
Action: Hold higher levels of cash and rebalance risk as necessary on this rally.
Monthly View
Like the daily and weekly analysis above, the market has confirmed a “sell signal” on a monthly basis as well. The good news here is that the long-term moving average, which is a critical level of bullish trend support, has NOT been violated as of yet. This suggests the longer-term bullish trend remains intact and we should not get overly conservative just yet.
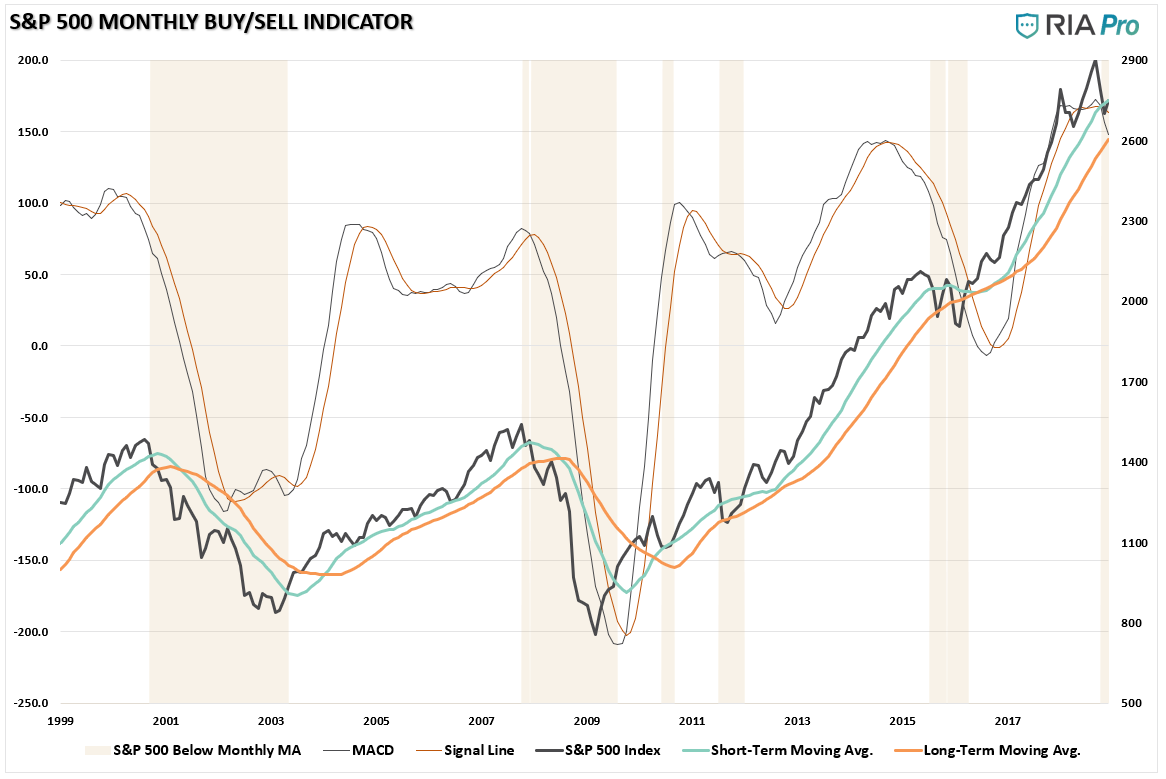
Nonetheless, the deterioration in the markets is extremely concerning, and while the official “bull market” is not dead as of yet, there are more than enough warnings which suggest erring to the side of caution, for now, is warranted.
Action: Use the current rally to reduce risk and rebalance portfolios accordingly.
As always, we will keep you apprised of what we are thinking.
You can also follow our actual portfolio models and positioning at RIA PRO.
Market & Sector Analysis
Data Analysis Of The Market & Sectors For Traders
S&P 500 Tear Sheet
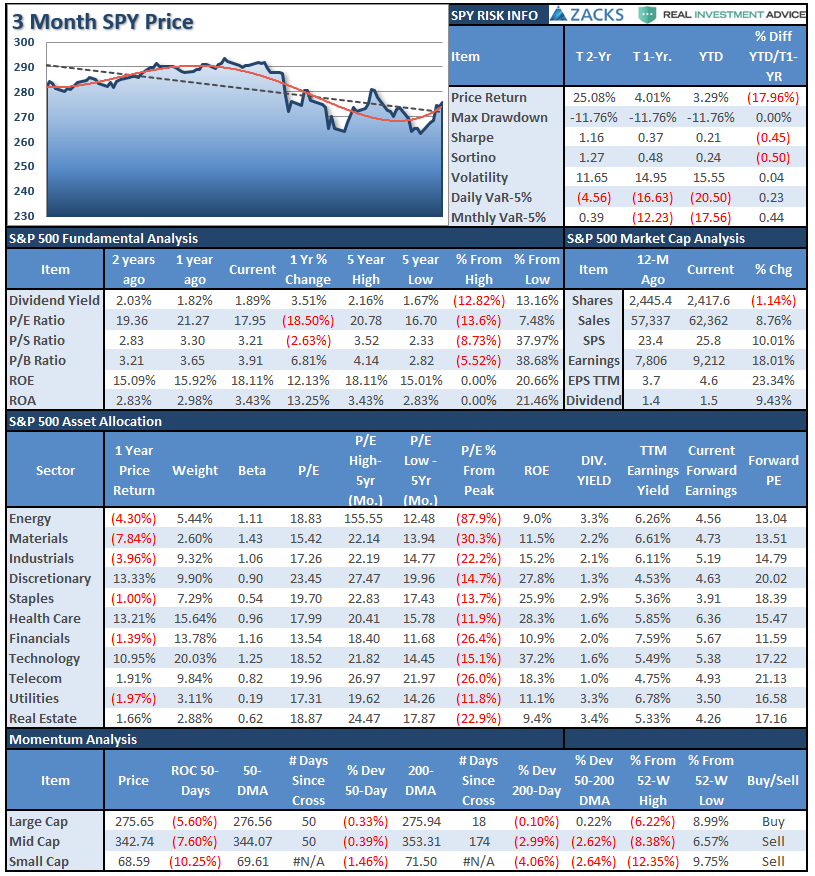
Performance Analysis
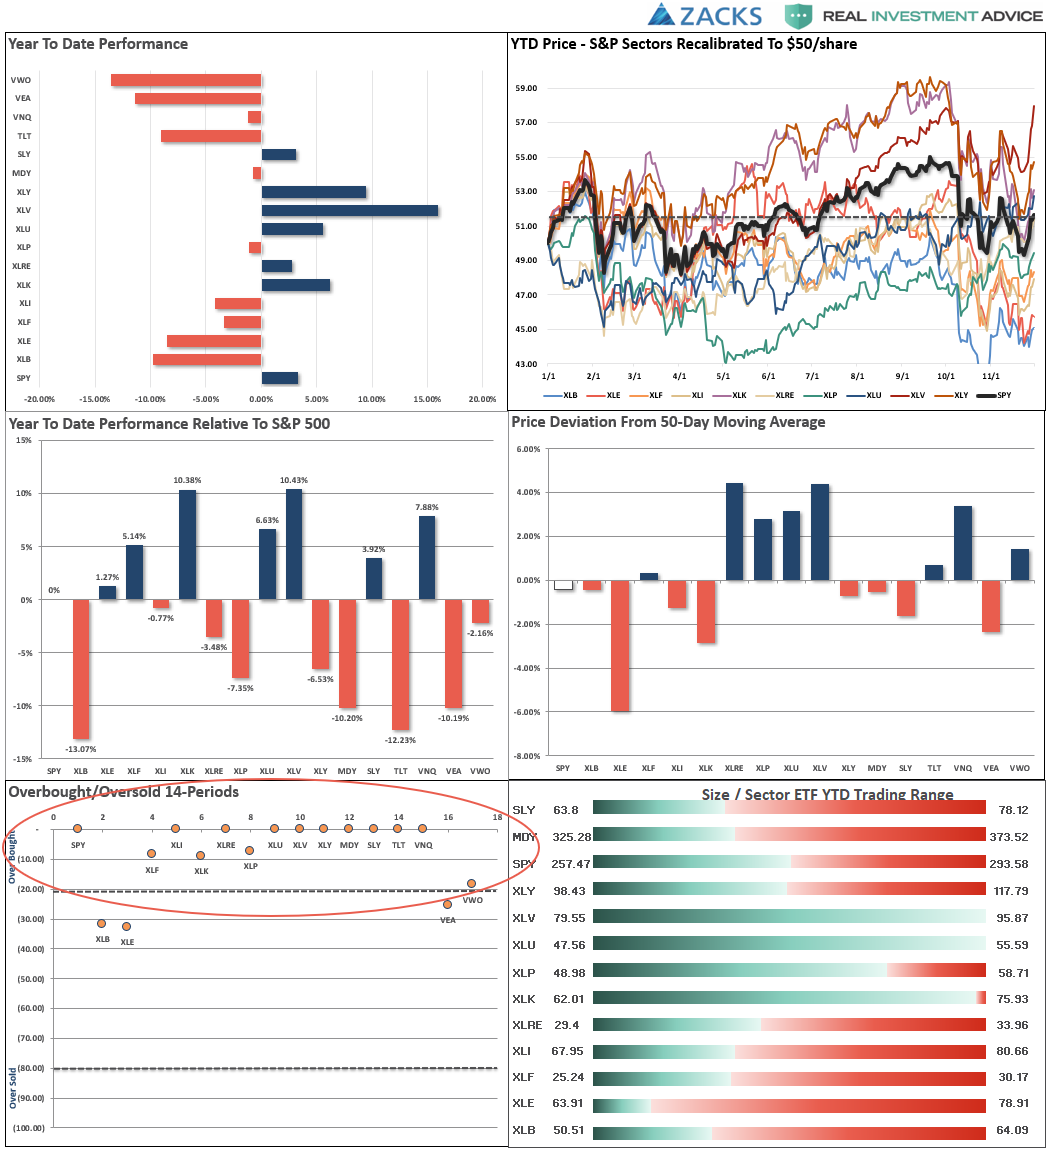
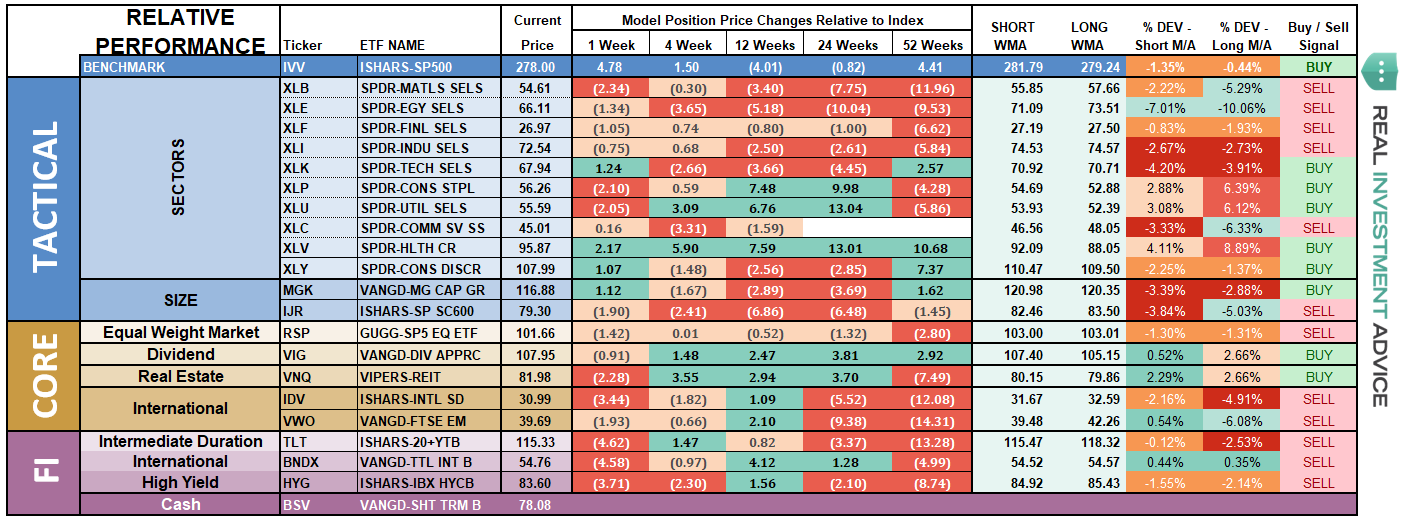
ETF Model Relative Performance Analysis
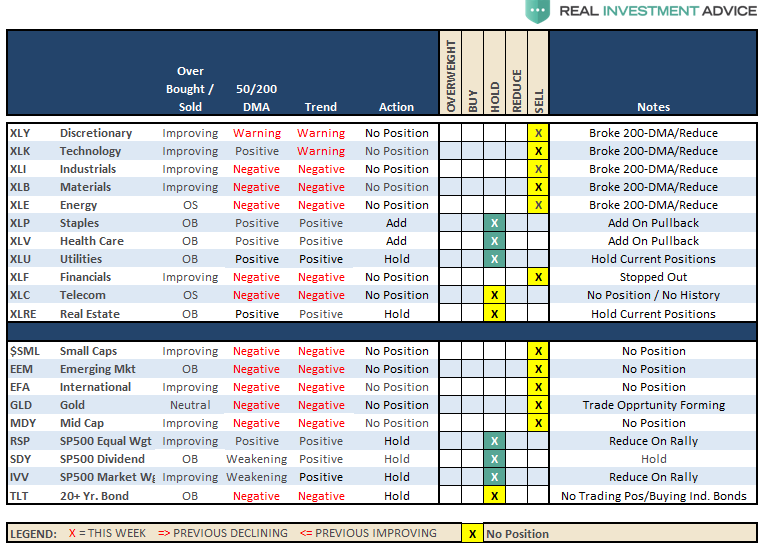
Sector & Market Analysis:
Sector-by-Sector
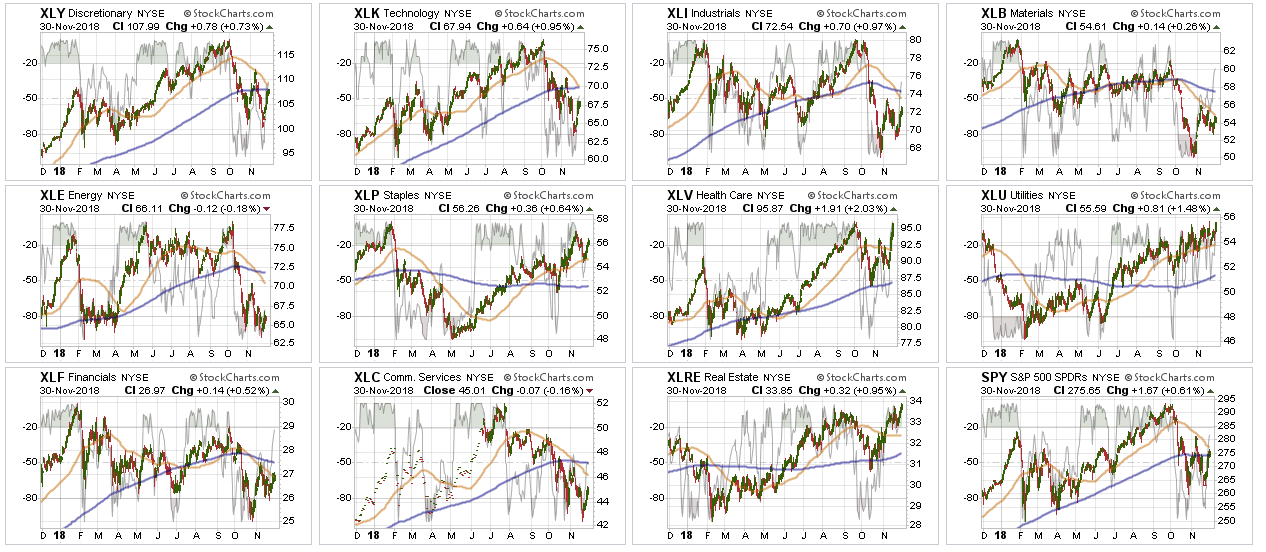
Discretionary and Technology After having violated the 200-dma, the sectors finally put together a rally last week. Discretionary, like the broader market, is running into resistance at the 200-dma with the 50-dma just above and heading lower. The same goes for Technology, but tech remains a decent distance below the 200-dma with a crossover of the 50-dma approaching rapidly. Given Tech is a huge weighting of the overall market, the bearish backdrop for the sector should not be dismissed.
Industrials, Materials, Energy, Financials, Communications – We are currently out of all of these sectors as the technical backdrop is much more bearish. With all of these sectors wrestling with the 50-dma which is running below the 200-dma the downside pressure remains on for these sectors as a whole. If you choose to be long these sectors it is advisable to remain underweight for now. Industrials, Materials, and Energy are representative of the broader economic activity in the U.S. and currently suggests we are seeing weakness on the horizon.
Real Estate, Staples, Healthcare, and Utilities continue to be bright spots. We continue to remain long staples and healthcare specifically. Despite a seemingly more bullish backdrop for the markets over the last few days, money is still primarily gravitating to traditionally more defensive sectors of the market.
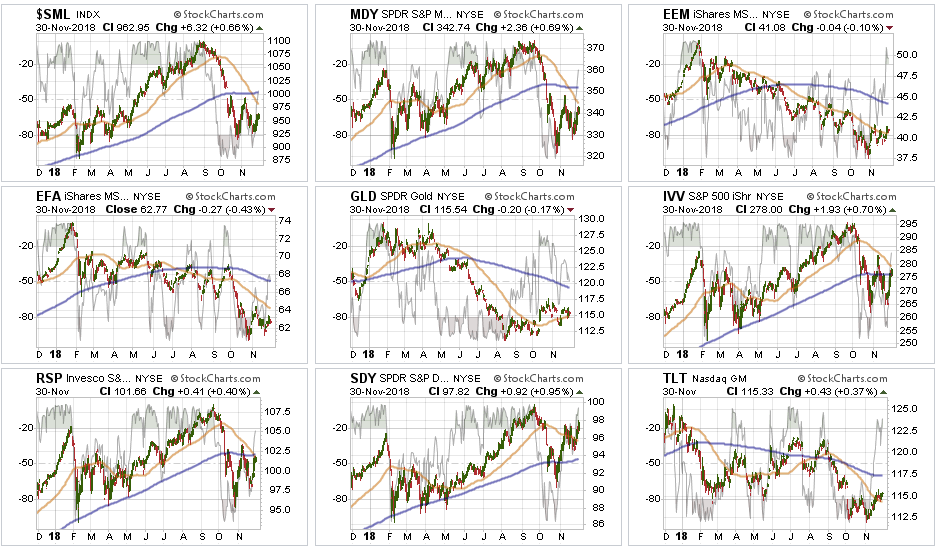
Small-Cap and Mid Cap – both of these markets are currently on macro-sell signals and the recent rally in both markets failed to get above technical resistance. More importantly, the previous oversold condition is now gone and suggests lower prices are coming. Like Industrials and Materials above, Small and Mid-cap stocks are very economically sensitive and suggests a much weaker backdrop going into 2019. We remain out of these sectors for now.
Emerging and International Markets – Emerging markets broke above its downward trending 50-dma last week and showed some signs of life. We have seen this before which ultimately led to lower lows. However, a recent series of higher bottoms suggests a bottom might be forming. We will look for a tradable opportunity but need some more confirmation first. International markets still look terrible and no improvement is being made there just yet. With major sell signals in place currently, there is still no compelling reason to add these markets to portfolios at this time.
Dividends, Market, and Equal Weight – Not surprisingly, given the rotation to “defensive” positioning in the market, dividend based S&P Index is leading the charge and is approaching all-time highs. Given the drag from Technology and Finance as of late S&P equal weight index is the lagging the S&P market-cap weighted index by a small amount. The overall market dynamic remains negative for now.
Gold – Gold remains in a downtrend, but the good news is the price continues to hug along the 50-dma which has turned up. We are still looking for a “sign” there is a committed trade to the metal before getting back in after having been out of the trade since 2013. Move stops up to $114 if you are still long the metal.
Bonds – continued to perform better last week and after a successful retest of the 50-dma have turned higher. Currently, bonds are very overbought which likely suggests a pullback is coming which would coincide with a further rally in the stock market through the end of year. However, such a pullback will likely provide a good buying opportunity as evidence of broader economic weakness continues to mount. We remain long our core bond holdings for capital preservation purposes but all trading positions are currently closed.
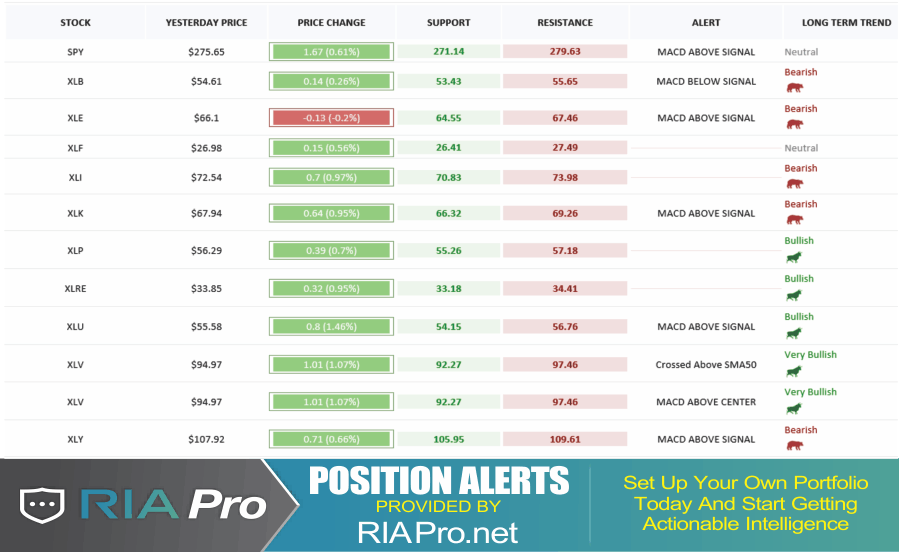
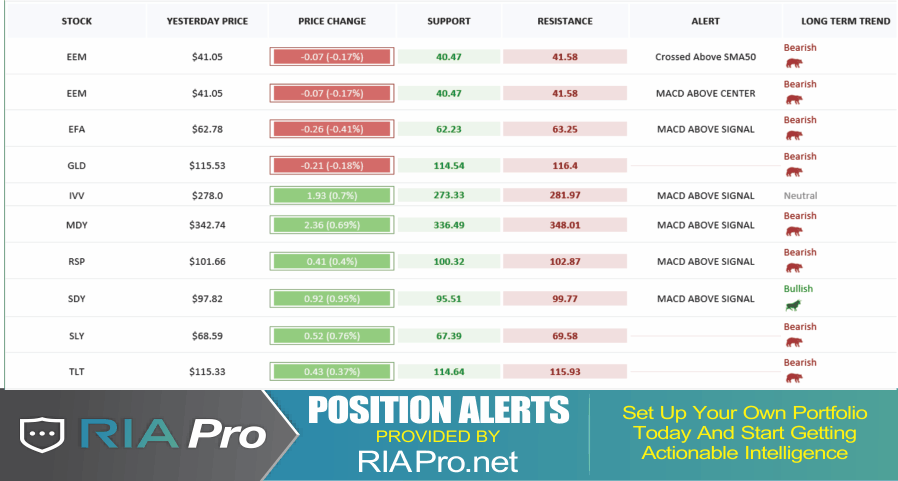
The table below shows thoughts on specific actions related to the current market environment.
(These are not recommendations or solicitations to take any action. This is for informational purposes only related to market extremes and contrarian positioning within portfolios. Use at your own risk and peril.)
Portfolio/Client Update:
As noted last week, the market action remains troubling, to say the least. The bullish trend longer-term remains intact but more bearish dynamics are rising. However, after having got stopped out of many of our positions over the last several weeks were are currently more underweight equity than we should be.
We are looking to add some selective exposure over the next week particularly if progress is made on the “trade” front between the U.S. and China.
- New clients: We will continue to hold existing positions and add new positions selectively.
- Equity Model: On Friday, we added 1/2 weights to AEP, AXP, CMCSA, MDLZ, MDT, MMM, CHCT, and CDW. We will look to bring existing 1/2 weight positions to full model weights. Stops have been dramatically tightened up.
- Equity/ETF blended – Same as with the equity model.
- ETF Model: We will look to add further exposure this coming week if a positive outcome from the G-20 presents itself.
Again, we are moving cautiously. There is mounting evidence of short to intermediate-term risk of which we are very aware. However, with the market moving into the seasonally strong period of the year, we realize that short-term performance is just as important as the long-term. It is always a challenge to marry both.
It is important to understand that when we add to our equity allocations, ALL purchases are initially “trades” that can, and will, be closed out quickly if they fail to work as anticipated. This is why we “step” into positions initially. Once a “trade” begins to work as anticipated, it is then brought to the appropriate portfolio weight and becomes a long-term investment. We will unwind these actions either by reducing, selling, or hedging, if the market environment changes for the worse.
THE REAL 401k PLAN MANAGER
The Real 401k Plan Manager – A Conservative Strategy For Long-Term Investors
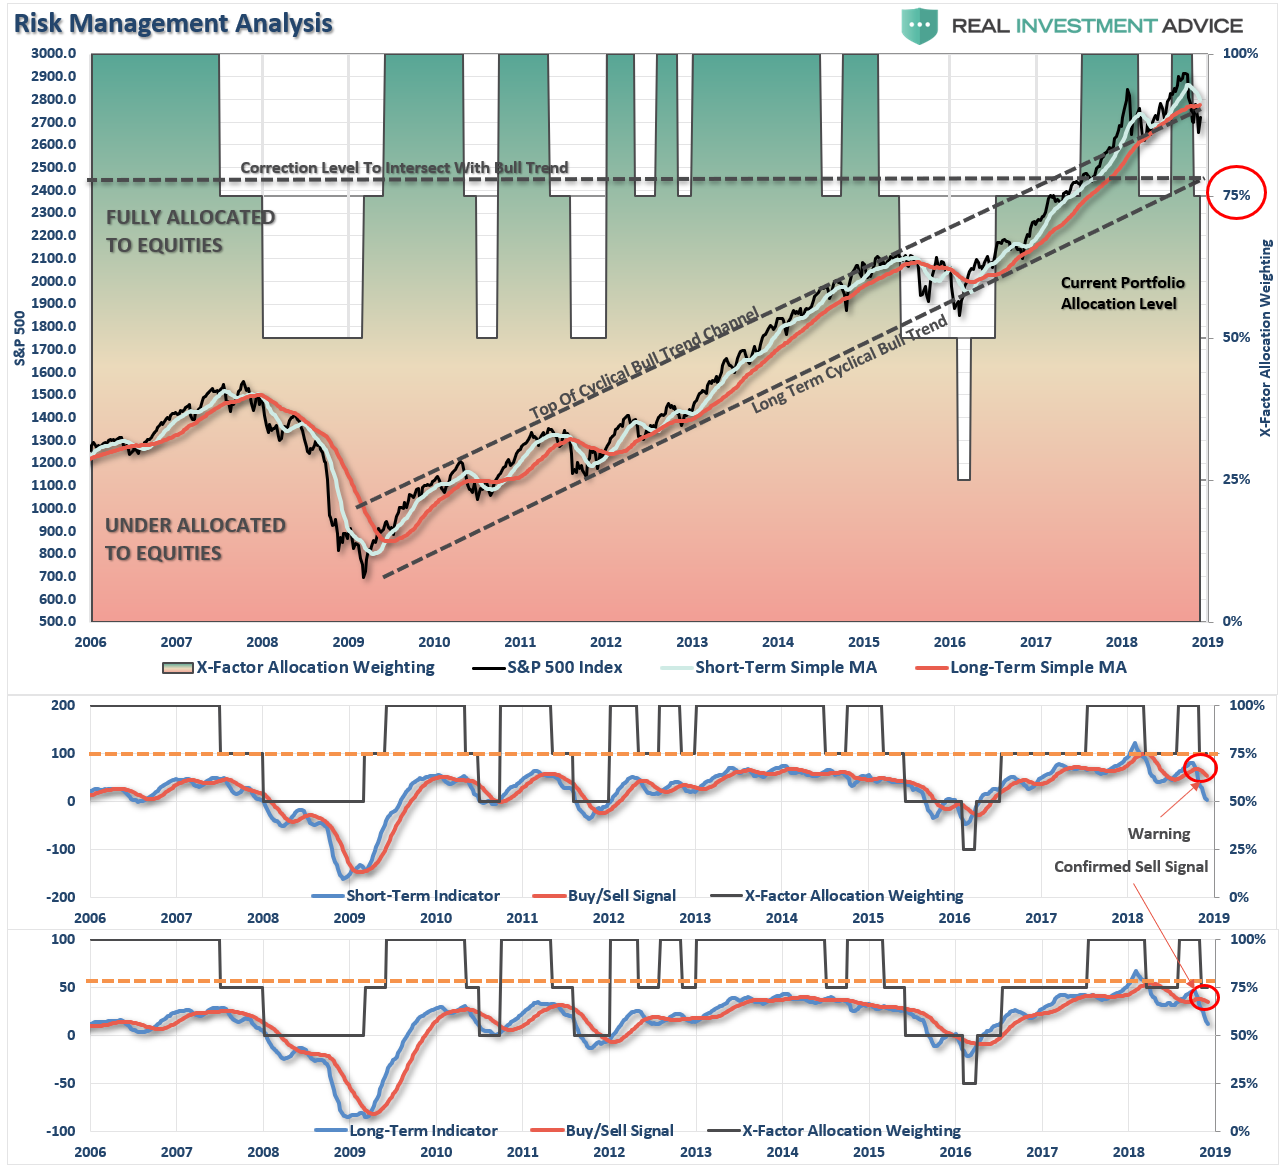
There are 4-steps to allocation changes based on 25% reduction increments. As noted in the chart above a 100% allocation level is equal to 60% stocks. I never advocate being 100% out of the market as it is far too difficult to reverse course when the market changes from a negative to a positive trend. Emotions keep us from taking the correct action.

Hold Onto The Reins
As I stated last week:
“Next week, it is critically important for the market to rally IF the bulls are going to regain control of the market. It didn’t and the bulls are in a very weak position currently.”
The good news is that over the last few days the bulls finally strung together a rally. However, it hasn’t changed much as the market remains close to registering a much more important long-term “sell” signal.
However, it is important to recognize that markets are generally optimistically biased and looks for “reasons” to rally regardless of whether there is real “merit” to it.
Last week was a good example as stocks rallied on news from the Fed they were close to ending rate hikes and hopes that Trump would cease the “trade war” with China. There isn’t much merit to either one of these reasons but the markets avoided any real analysis to go with “hope.”
We are maintaining our current weightings in our 401k plans for now until we see where the current bout of optimism can get us to. With confirmed “sell signals” in place, defense remains our primary strategy for 401k-plans currently.
Continue to use rallies to reduce risk towards a target level with which you are comfortable. Remember, this model is not ABSOLUTE – it is just a guide to follow.
- If you are overweight equities – reduce international, emerging market, mid, and small-capitalization funds on any rally next week. Reduce overall portfolio weights to 75% of your selected allocation target.
- If you are underweight equities – reduce international, emerging market, mid, and small-capitalization funds on any rally next week but hold everything else for now.
- If you are at target equity allocations hold for now.
Unfortunately, 401k plans don’t offer a lot of flexibility and have trading restrictions in many cases. Therefore, we have to minimize our movement and try and make sure we are catching major turning points. Over the next couple of weeks, we will know for certain as to whether more changes need to be done to allocations as we head into the end of the year.
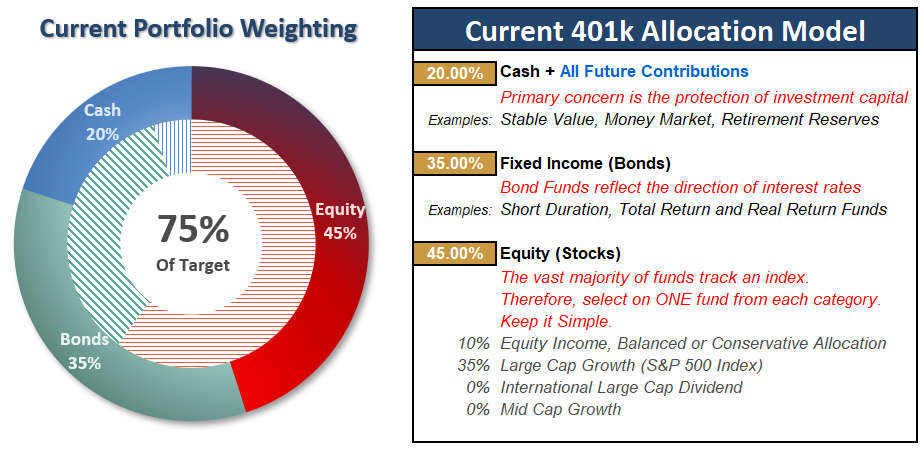
Current 401-k Allocation Model
The 401k plan allocation plan below follows the K.I.S.S. principle. By keeping the allocation extremely simplified it allows for better control of the allocation and a closer tracking to the benchmark objective over time. (If you want to make it more complicated you can, however, statistics show that simply adding more funds does not increase performance to any great degree.)
401k Choice Matching List
The list below shows sample 401k plan funds for each major category. In reality, the majority of funds all track their indices fairly closely. Therefore, if you don’t see your exact fund listed, look for a fund that is similar in nature.

Disclosure: The information contained in this article should not be construed as financial or investment advice on any subject matter. Real Investment Advice is expressly disclaims all liability ...
more


