
Corn - Elliott Wave Technical Analysis
Corn Elliott Wave Analysis
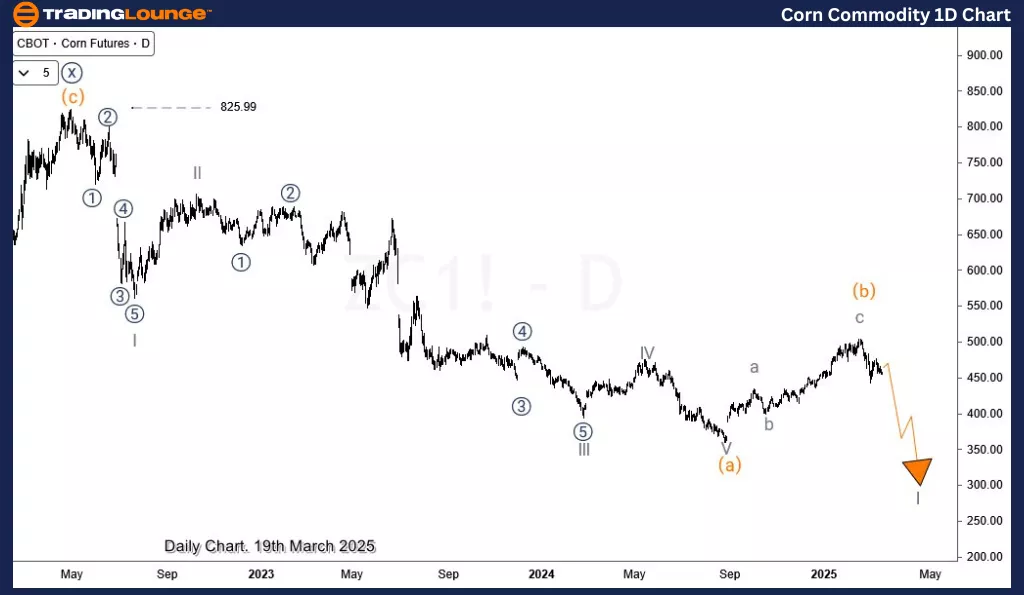
Corn May Resume Bearish Trend Below 504.5
Corn appears poised to extend its bearish trend from the April 2022 peak, following the completion of a corrective rebound from the August 2024 low. As long as the price remains below 504.5, the downside bias should prevail in the short term.
Corn Daily Chart Analysis
On the daily timeframe, Corn has been in a prolonged downtrend since its April 2022 high of $826, declining sharply to a low of $359 in August 2024. This move unfolded as a five-wave bearish impulse, which we can label as wave (a) of the supercycle degree.
A corrective wave (b) followed, leading to a retracement toward $504. If this correction is complete, Corn is now positioned to commence wave (c) of the supercycle degree, potentially driving prices lower toward $220 in the coming months. However, there remains an alternate scenario where wave (b) extends further in a double correction before the decline resumes.
Corn H4 Chart Analysis
Zooming into the H4 timeframe, the internal structure of wave I of (c) is unfolding. The first bearish leg, labeled wave ((1)), ended on March 4, 2025. A subsequent corrective rally, forming wave ((2)), reached the key Fibonacci retracement zone.
However, as long as the wave ((1)) low remains intact, we cannot rule out the possibility of wave ((2)) extending higher toward $477 before the next decline begins. If the price breaks below the wave ((1)) low, we can anticipate further downside targeting the 417-394 zone.

Technical Analyst: Sanmi Adeagbo
More By This Author:
Elliott Wave Technical Analysis: Block, Inc.
Elliott Wave Technical Analysis: AbbVie Inc. - Wednesday, March 19
Elliott Wave Technical Analysis: U.S. Dollar/Swiss Franc - Wednesday, March 19
At TradingLounge™, we provide actionable Elliott Wave analysis across over 200 markets. Access live chat rooms, advanced AI & algorithmic charting tools, and curated trade ...
more

