
(Click on image to enlarge)
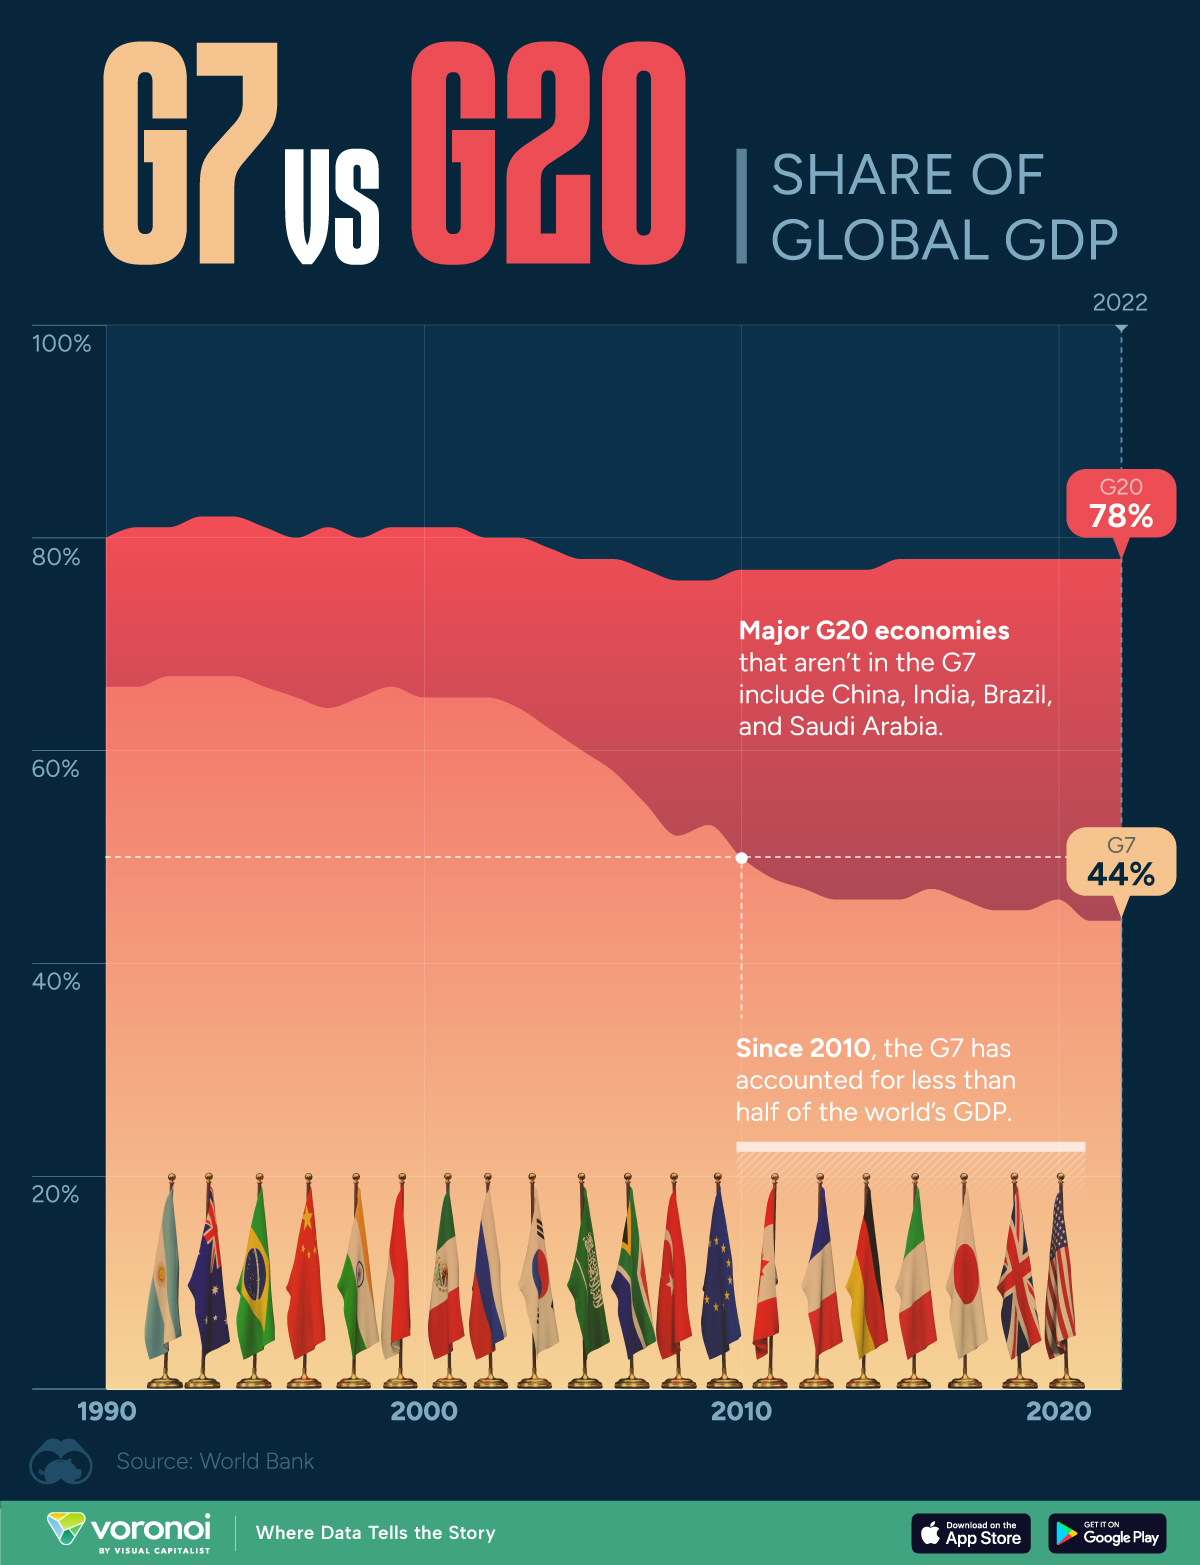
Formed in 1975, the G7 is a group of seven advanced economies (U.S., Canada, UK, Germany, France, Italy, Japan) that cooperates on economic policy and promotes global stability. At the time of the group’s inception, these countries were leading nations in the post-World War II economic order and shared similar political and economic systems.
While much of this is still true today, the G7’s collective economic influence has fallen significantly as emerging nations in other parts of the world have grown.
To learn more about this trend, we’ve visualized the G7’s share of global GDP beside the G20’s, from 1990 to 2022. Numbers come from the World Bank, accessed via the Council on Foreign Relations.
Data and Key Takeaway
The G20 is an expanded group that was established with the goal of bringing together advanced and emerging economies to promote international cooperation. Major economies that are in the G20, but not in the G7, include China, India, Brazil, and Saudi Arabia.
The data we used to create this graphic can be found in the table below.
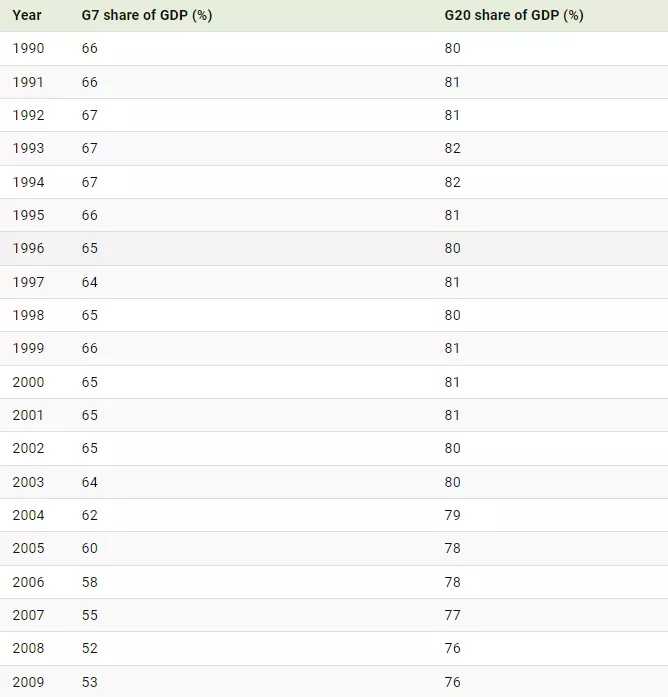
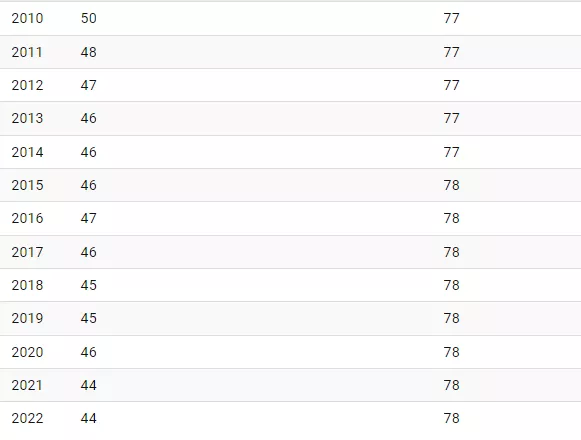
From this dataset, we can see that the G7’s share of global GDP has shrunk from 67% in 1994 to 44% in 2022.
Over this same time period, the G20’s share of global GDP has remained relatively steady near 80%. In short, this means that emerging markets are accounting for a relatively greater share of the world’s economy.
What Does This Mean for the G7?
Here are some possible consequences of the G7’s declining share of global GDP:
- Reduced Global Influence: Diminished ability to shape global economic policies and standards.
- Changes in Trade Dynamics: Potential shifts in trade relationships and alliances as other countries gain economic prominence.
- Altered Investment Flows: Redirection of global investment towards faster-growing economies outside the G7.
Learn More About the Global Economy From Visual Capitalist
If you enjoyed this post, check out this infographic that visualizes the top six countries share of global GDP over time.
More By This Author:
Charted: Visa, Mastercard, And UnionPay Transaction VolumesRanked: The Largest Sector ETFs, By AUM
Charted: Average Wage Growth In G7 Countries (2000-2022)


Comments
Log in or sign up to join the conversation.