
(Click on image to enlarge)
Average wage growth is a key sign of how well a country’s economy is doing.
When wages rise, it typically signals that businesses are thriving and can afford to pay their employees more, which in turn boosts consumer spending and stimulates further economic growth.
On the other hand, stagnant or declining wages can indicate economic challenges, such as high unemployment, low productivity, or weak business performance.
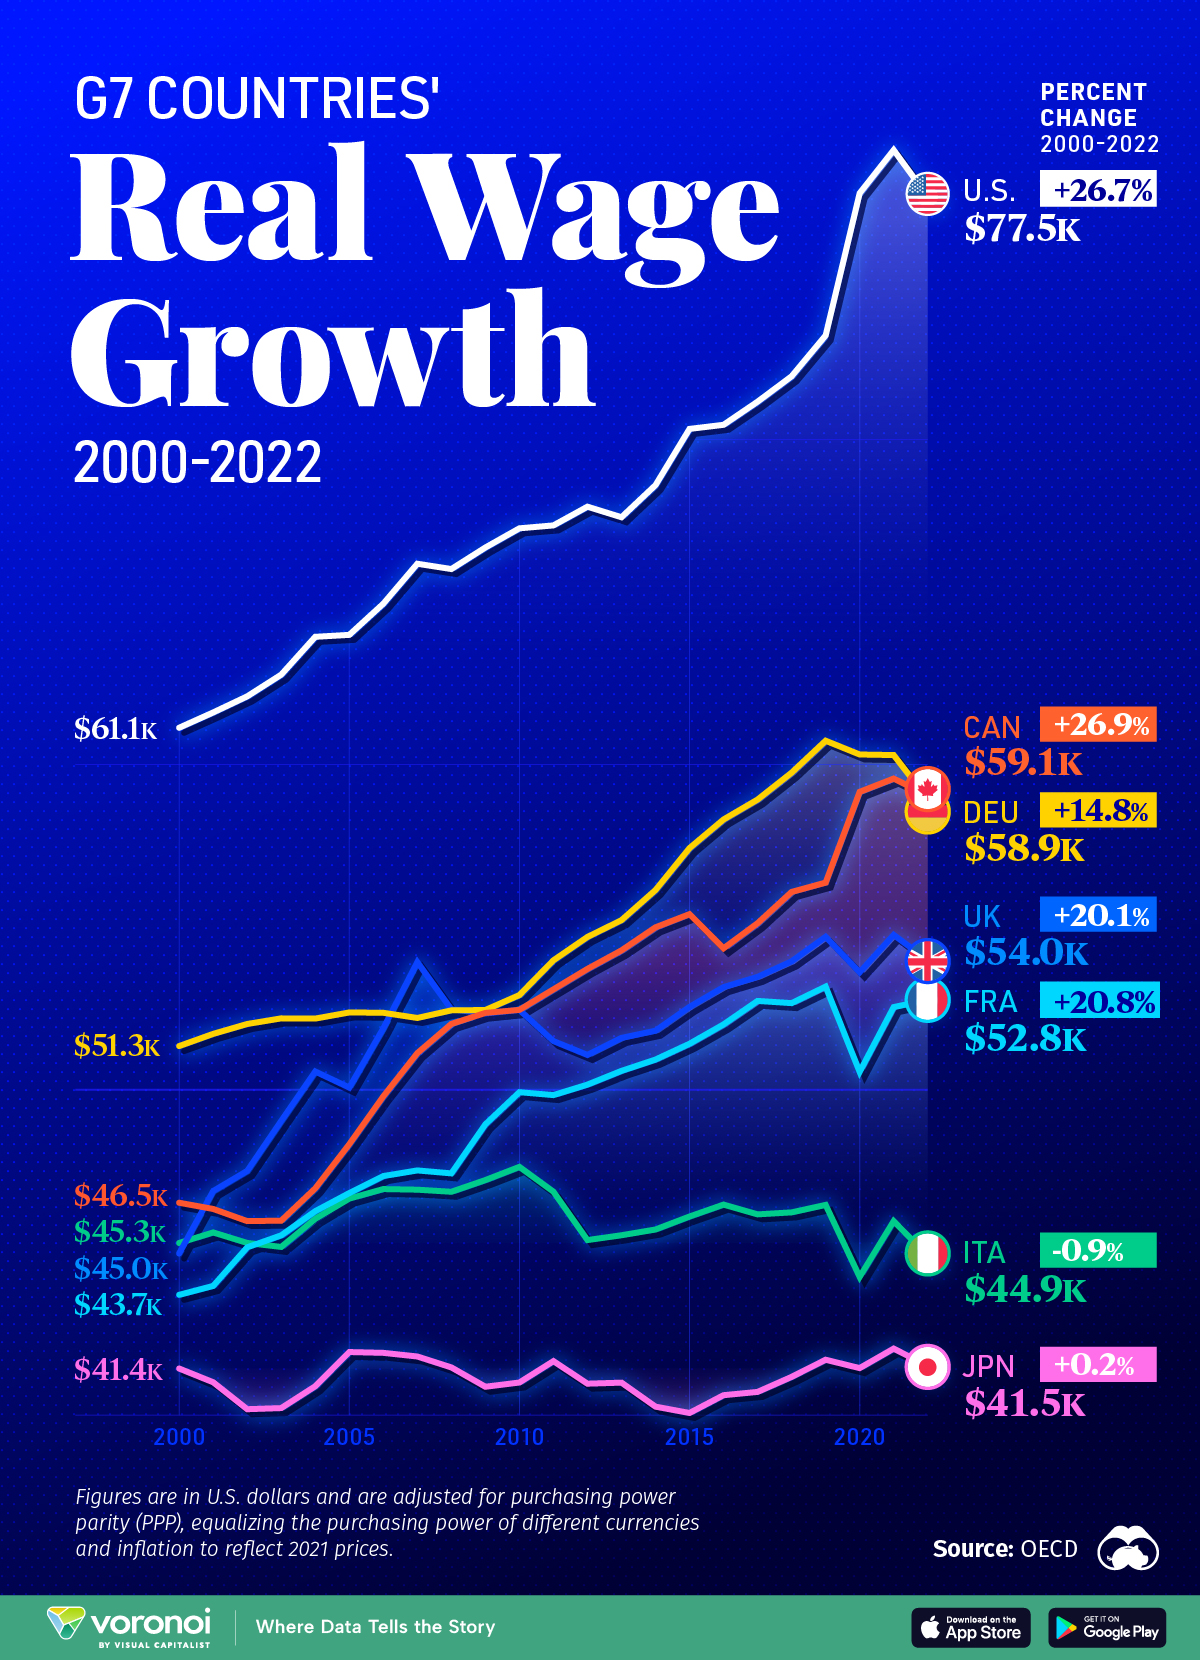
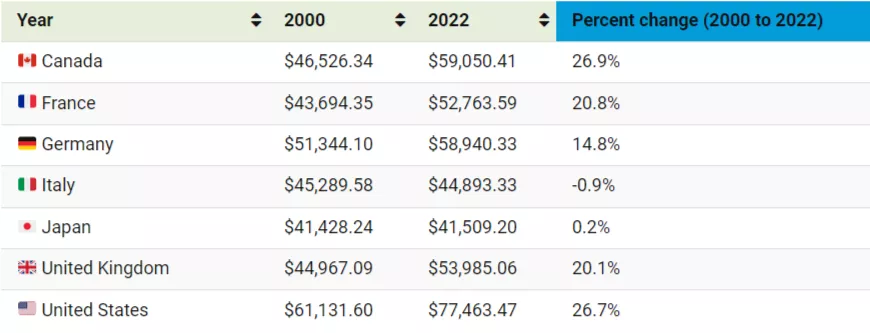
This graph shows the average annual real wage growth for full-time workers of G7 countries from 2000 to 2022. The data comes from the OECD and is updated as of March 2024.
Data is in U.S. dollars and adjusted for purchasing power parity (PPP), which equalizes the purchasing power of different currencies. Wages are adjusted for inflation to reflect 2021 prices.
Japan and Italy Lag Behind
Most G7 countries have seen steady wage growth in the past two decades, but it’s the United States that has been clearly outperforming its peers in growing average wages.
Meanwhile, Italy is the only G7 country that saw its average annual wage in 2022 fall below what it was over 20 years ago, in real terms.
With prolonged periods of economic stagnation and a larger share of small-to-medium firms that tend to pay below-average wages, Italy is falling behind other advanced economies.
However, it’s not strictly and Italian problem, as European countries in general are being noted for their overall economic stagnation.
While seeing slightly (0.2%) higher wages compared to 2000, Japan is also lagging far behind its G7 counterparts.
The East Asian country has consistently had the lowest wages among all G7 countries in the past two decades. Japan’s stagnant wages can be attributed to long periods of deflation, a focus on maintaining employment over raising wages, and a strong emphasis on seniority-based pay and lifetime employment.
Japan also had the lowest labor productivity rate among G7 countries in 2022, another factor contributing to its low average wages.
More By This Author:
Charted: Global Wheat Production By Country
The Price Of Entertainment Subscription Services, Charted
Charted: Inflation Across U.S. Fast Food Chains (2014-2024)


Comments
Log in or sign up to join the conversation.