

Image Source: Pexels
Here’s a picture of some key indicators followed by the NBER BCDC, along with monthly GDP:
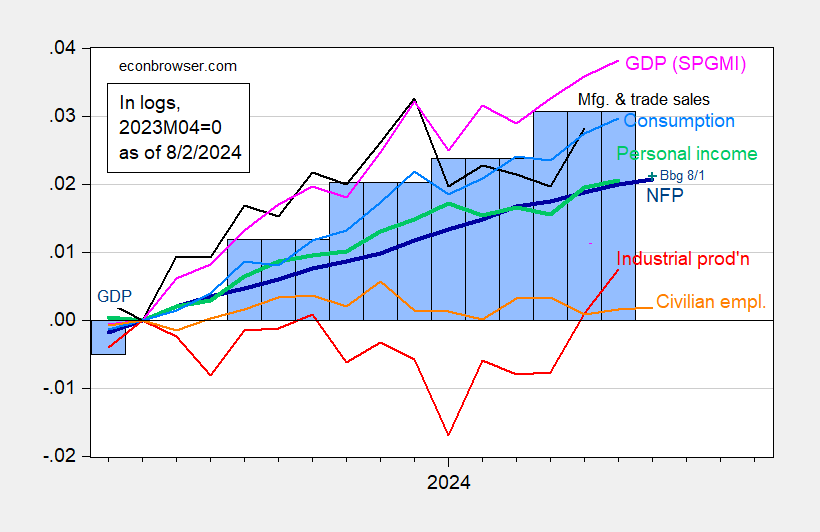
Figure 1: Nonfarm Payroll (NFP) employment from CES (bold blue), civilian employment (orange), industrial production (red), personal income excluding current transfers in Ch.2017$ (bold green), manufacturing and trade sales in Ch.2017$ (black), consumption in Ch.2017$ (light blue), and monthly GDP in Ch.2017$ (pink), GDP (blue bars), all log normalized to 2023M04=0. Source: BLS via FRED, Federal Reserve, BEA 2024Q2 advance release, S&P Global Market Insights (nee Macroeconomic Advisers, IHS Markit) (8/1/2024 release), and author’s calculations.
With positive (albeit slower) employment growth, it’s hard to believe that a recession began in July, even taking into consideration the fact that the Sahm rule indicator has breached the 0.50 threshold (at 0.50 ppts). When calculations are taken to three significant digits (two decimal places), the indicator using current data is reading 0.49 ppts.
NFP is the first monthly reading we have for July. The Lewis/Mertens/Stock NY Fed WEI is reading 1.95% for data released through week ending 7/27. The corresponding Baumeister/Leiva-Leon/Sims WECI is reading 0.15, which means — if trend growth is 2% — a growth rate of 2.15%.
More By This Author:
Employment: Different Measures
“Yellen Rebuffs Trump Argument On Dollar Hurting US Manufacturing”
GDP Per Capita


Comments
Log in or sign up to join the conversation.