

Image Source: Pixabay
NFP comes under, 114K vs. 176K consensus. Private NFP also missed, +97K vs. +148K consensus.
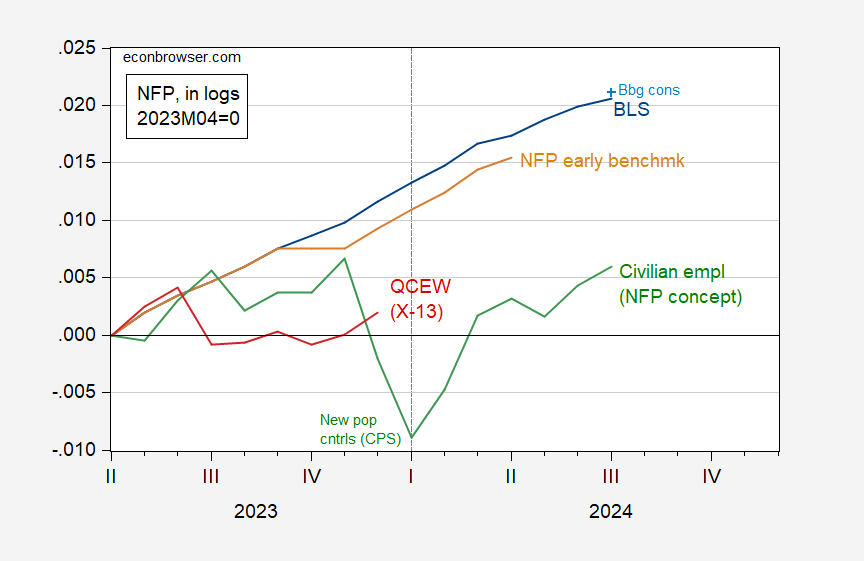
Figure 1: Nonfarm payroll employment from CES (blue), early benchmark (tan), QCEW seasonally adjusted by author using X-13 (red), and CPS series adjusted to NFP concept (green), all in logs, 2023M04=0. Source: BLS via FRED, BLS, Philadelphia Fed and author’s calculations.
The July NFP is below implied consensus level because growth was less than expected, and June was revised down 29K.
While the research series for CPS series adjusted to NFP concept has shown sideways trending over the last few months, some caution is necessary in interpretation. This series inherits the characteristics population controls for civilian employment. If there is undercounting of the population (say because of undercounting of net immigration), then this will show up here.
Figure 1 pertains to total nonfarm payroll employment; what about private NFP?
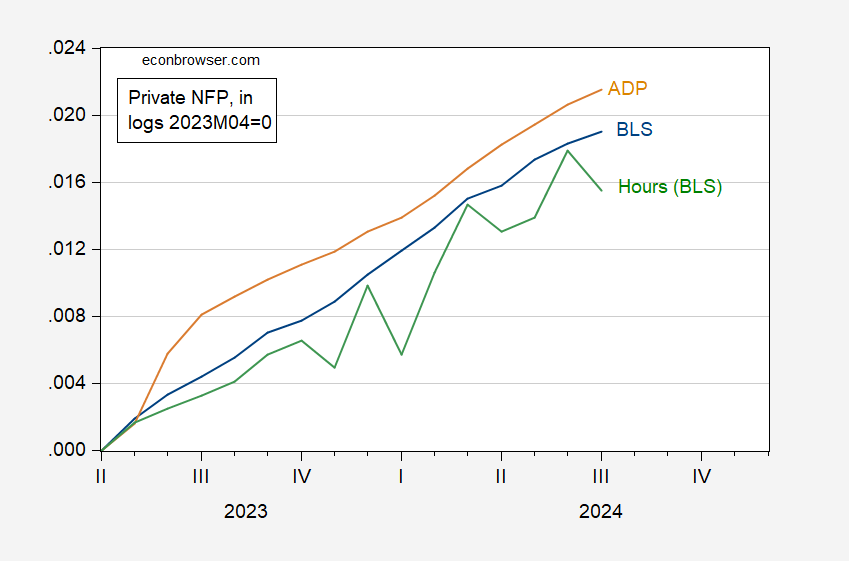
Figure 2: Private nonfarm payroll employment from CES (blue), from ADP-Stanford (tan), QCEW private aggregate hours (green), all in logs, 2023M04=0. Source: BLS, ADP via FRED and author’s calculations.
The ADP series does not rely upon the birth-death model, hence represents independent estimate of private NFP. On the other hand, aggregate hours are down, in contrast to employment. So, it seems safe to say the labor market is cooling.
The Sahm Rule real time indicator now reads at 0.53 ppts, above the 0.5 ppt threshold for recession. As a minor caveat, if one uses three significant digits in calculating the Sahm Rule indicator (currrent data), the current reading is 0.49 ppts…
More By This Author:
“Yellen Rebuffs Trump Argument On Dollar Hurting US Manufacturing”GDP Per Capita
Inflation Expectations In July (And June)


Comments
Log in or sign up to join the conversation.