

Image source: Pixabay
Are you better off than you were 4 years ago?
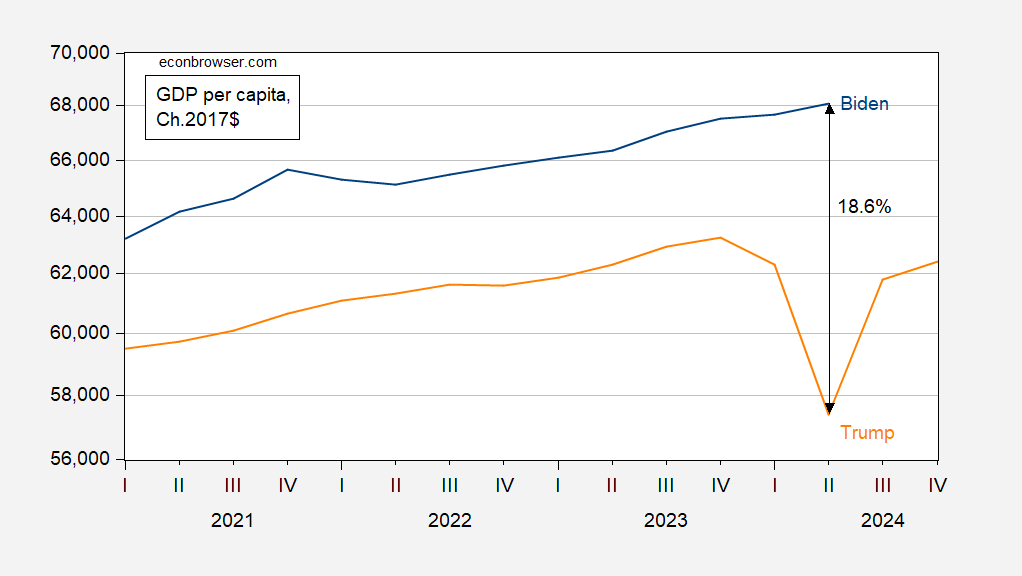
Figure 1: GDP per capita (blue), lagged 4 years (orange), in 2017$, SAAR. Source: BEA via FRED.
Yes, by 18.6% in output terms. What about cumulative change from beginning of administration?
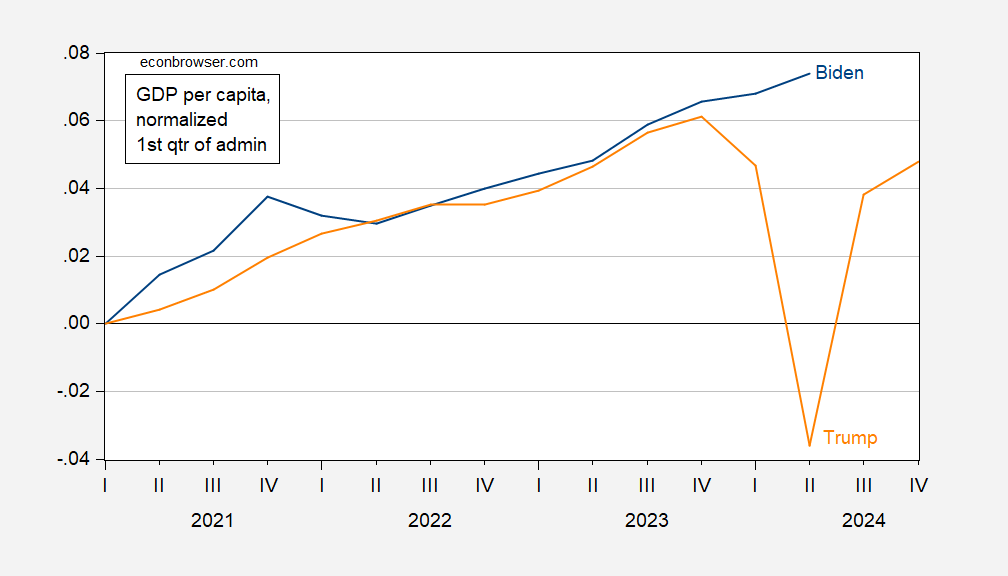
Figure 2: Log GDP per capita since 2021Q1 (blue), since 2017Q1 (orange), in 2017$, SAAR. Source: BEA via FRED.
Note that even when comparing per capita income just before the pandemic to 2023Q4 output, it’s looking better under Biden.
More By This Author:
Inflation Expectations In July (And June)Russia: Policy Rate Raised To 18%
Business Cycle Indicators At End Of July


Comments
Log in or sign up to join the conversation.