

Image source: Pixabay
Nominal consumption, PCE deflator m/m at consensus, nominal income at +0.2% vs. +0.4%. Here’s the picture of key NBER BCDC indicators plus monthly GDP:
(Click on image to enlarge)
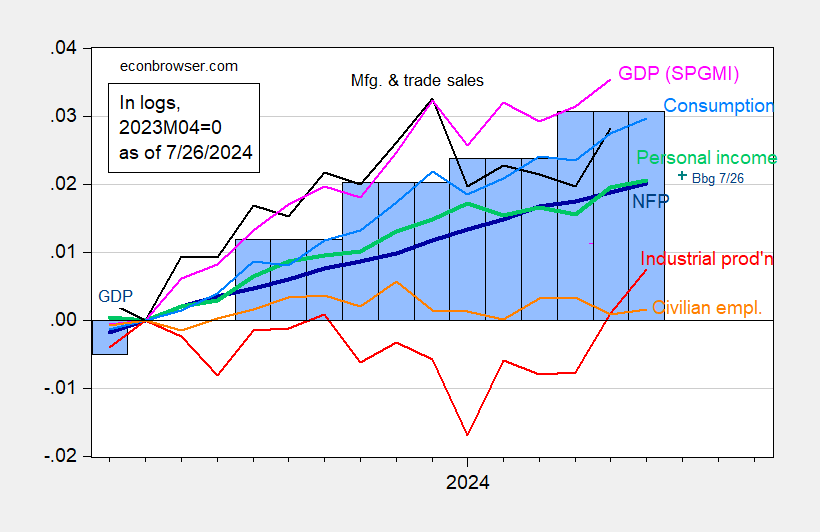
Figure 1: Nonfarm Payroll (NFP) employment from CES (bold blue), civilian employment (orange), industrial production (red), personal income excluding current transfers in Ch.2017$ (bold green), manufacturing and trade sales in Ch.2017$ (black), consumption in Ch.2017$ (light blue), and monthly GDP in Ch.2017$ (pink), GDP (blue bars), all log normalized to 2023M04=0. Source: BLS via FRED, Federal Reserve, BEA 2024Q1 third release, S&P Global Market Insights (nee Macroeconomic Advisers, IHS Markit) (7/1/2024 release), and author’s calculations.
More By This Author:
2024Q2 GDP Advance Release: Too Good To Be True?Still Strong After All These Years
CBO: Budgetary And GDP Implications Of The Immigration Surge


Comments
Log in or sign up to join the conversation.